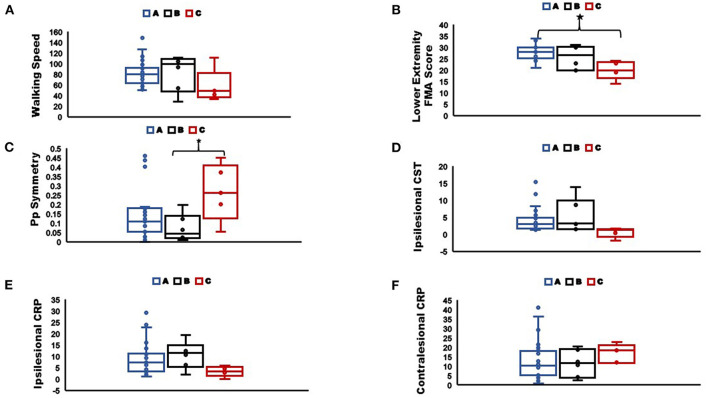
Figure 7.
Comparisons of (A) Walking speed; (B) Lower extremity Fugl-Meyer score; (C) Pp symmetry; (D) Ipsilesional CST streamlines; (E) Ipsilesional CRP streamlines; (F) Contralesional CRP streamlines, between sub-groups as classified by the classification tree (*indicate significant difference between groups at p < 0.05). The box plots indicate the range in the data, horizontal line in the center is the median, the upper and lower boundaries of the box indicate the upper and lower quartile respectively, and markers represent the extreme values. Group A: correctly classified individuals with more than two modules, Group B: incorrectly classified individuals with two modules, Group C: correctly classified individuals with two modules.

