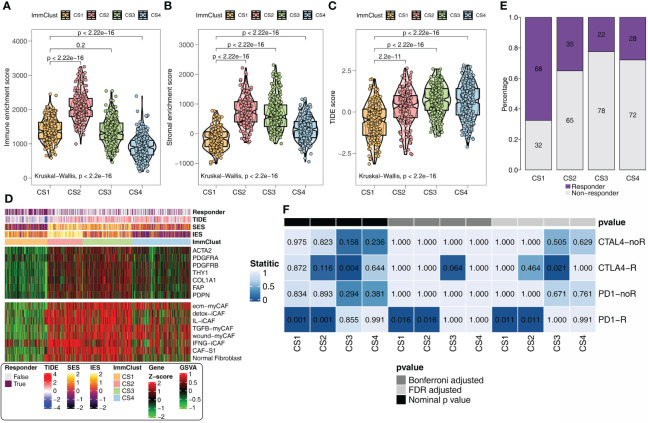
Figure 4.
Immunotherapy response analysis for the GEO. (A) Immune enrichment score for the four ImmClusts. (B) Stromal enrichment score for the four ImmClusts. (C) TIDE score for the four ImmClusts. (D) Response to immunotherapy of the four ImmClusts. (E) SubMap analysis for the four ImmClusts. (F) The heatmap showed the differences in the distribution of the four ImmClusts in CAF-related genes and signatures.

