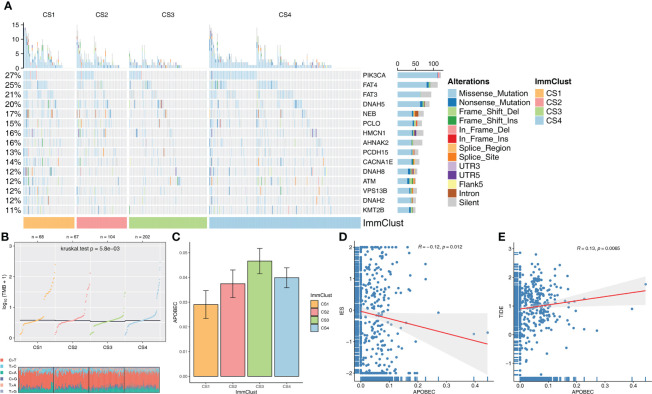
Figure 5.
Evaluation of mutation differences among the four ImmClusts. (A) The waterfall plot of somatic mutation features established with ImmClusts. (B) TMB and distribution of TiTv calculated by MOVICS for the four ImmClusts. (C) Apolipoprotein B mRNA-editing enzyme catalytic polypeptide-like (APOBEC) mutation weights of the four ImmClusts. (D) Correlation between immune enrichment score (IES) and APOBEC mutation weight. (E) Correlation between TIDE score and APOBEC mutation weight.

