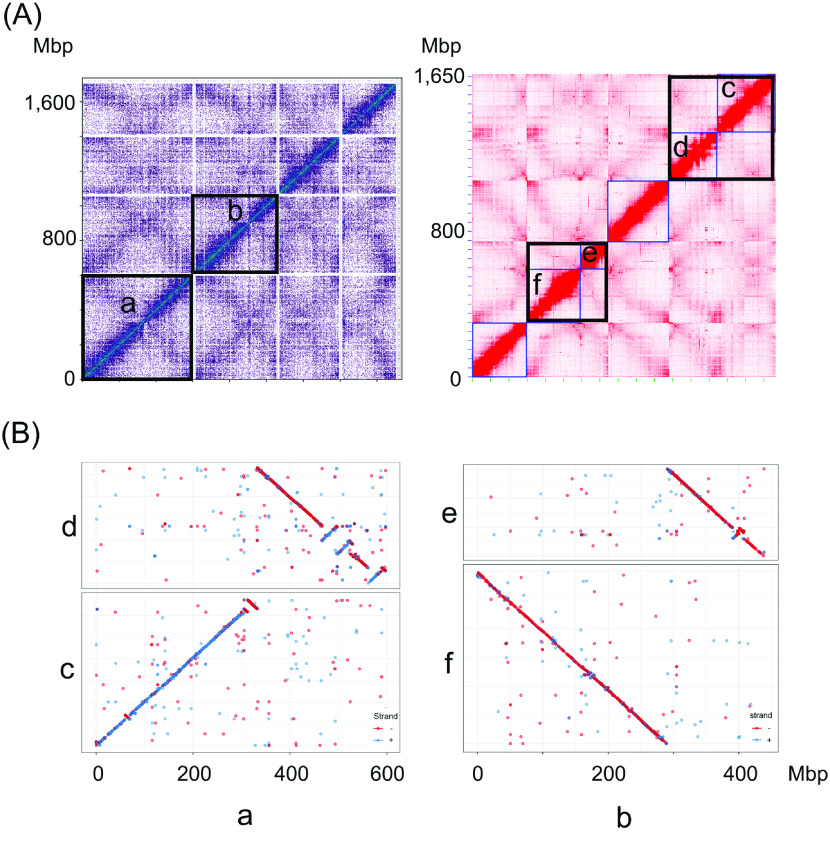
Figure 3.
Resolving misjoin sites in V. sativa pseudo-chromosomes. (A) The left figure shows the interaction heatmap of four pseudo-chromosomes generated by the HiRise pipeline. Regions in black boxes show the potential misjoined pseudo-chromosomes indicated by weak interaction signals. After rescaffolding the genome using the 3D-DNA pipeline, mi-joins were confirmed and resulted in six pseudo-chromosomes (right figure, black boxes). (B) The collinearity between pseudo-chromosomes “a” to “c” and “d”, and between pseudo-chromosomes “b” to “e” and “f” in (A) were confirmed by Mummer alignment.

