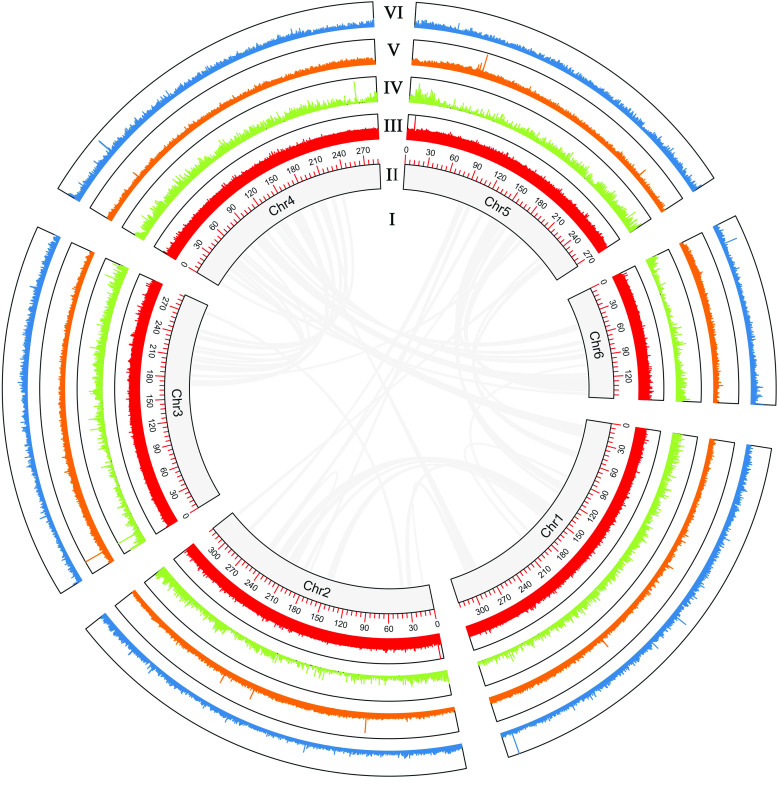
Figure 5.
Circos plot showing the characterization of the Vicia sativa genome assembly. (I) Syntenic regions within the V. sativa genome based on homology searches using MCscan in Jcvi (MCScan, RRID:SCR_017650) [75] requiring ≥10 genes per block (links). (II) Pseudo-chromosome length in Mbp. (III) GC content in non-overlapping 10 Kbp windows (histograms). (IV) Gene density in non-overlapping 10-Kbp windows (histograms). (V) LTR-transposable element density in non-overlapping 10-Kbp windows. (VI) Mutator TIR transposon density in non-overlapping 10-Kbp windows (histograms). Percentage of GC content, gene density, and transposable element density were calculated relative to the highest value present in the genome. Chr = pseudo-chromosome.

