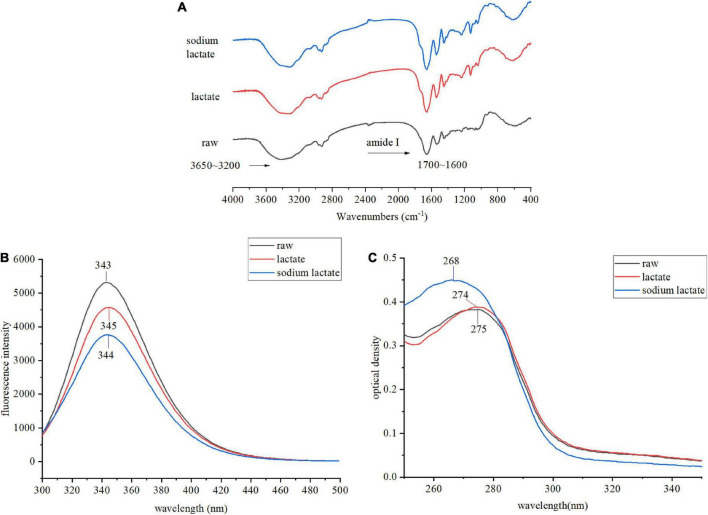
FIGURE 3.
Changes in the structural properties of gluten sample. (A) The FTIR spectra of raw gluten, lactate treated gluten, and sodium lactate treated gluten. (B) The intrinsic fluorescence spectra of raw gluten, lactate treated gluten, and sodium lactate treated gluten. The excitation wavelength was 280 nm, and the emission wavelength was from 300 to 500 nm. (C) The UV absorption spectra of raw gluten, lactate treated gluten and sodium lactate treated gluten. The UV absorption spectra were scanned from 200 to 400 nm, while the major absorption peak spectra were from 250 to 350 nm.

