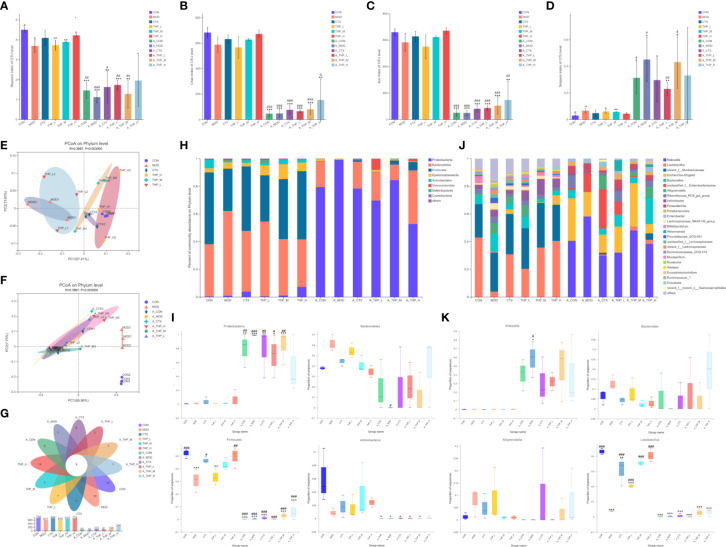
Figure 3.
THP alters the abundance and diversity of intestinal flora. (A) Simpson indices. (B) Ace indices. (C) Chao indices. (D) Shannon indices. (E, F) PCoA at the phylum level. (G) Venn diagram. (H) Relative abundance of microbiota at the phylum level. (I) Characteristic bacteria at the phylum level. (J) Relative abundance of microbiota at the genus level. (K) Characteristic bacteria at the genus level. Each value is presented as the mean ± SD. *P < 0.05, **P < 0.01, ***P < 0.001 versus CON; #P < 0.05, ##P < 0.01, ###P < 0.001 versus MOD.

