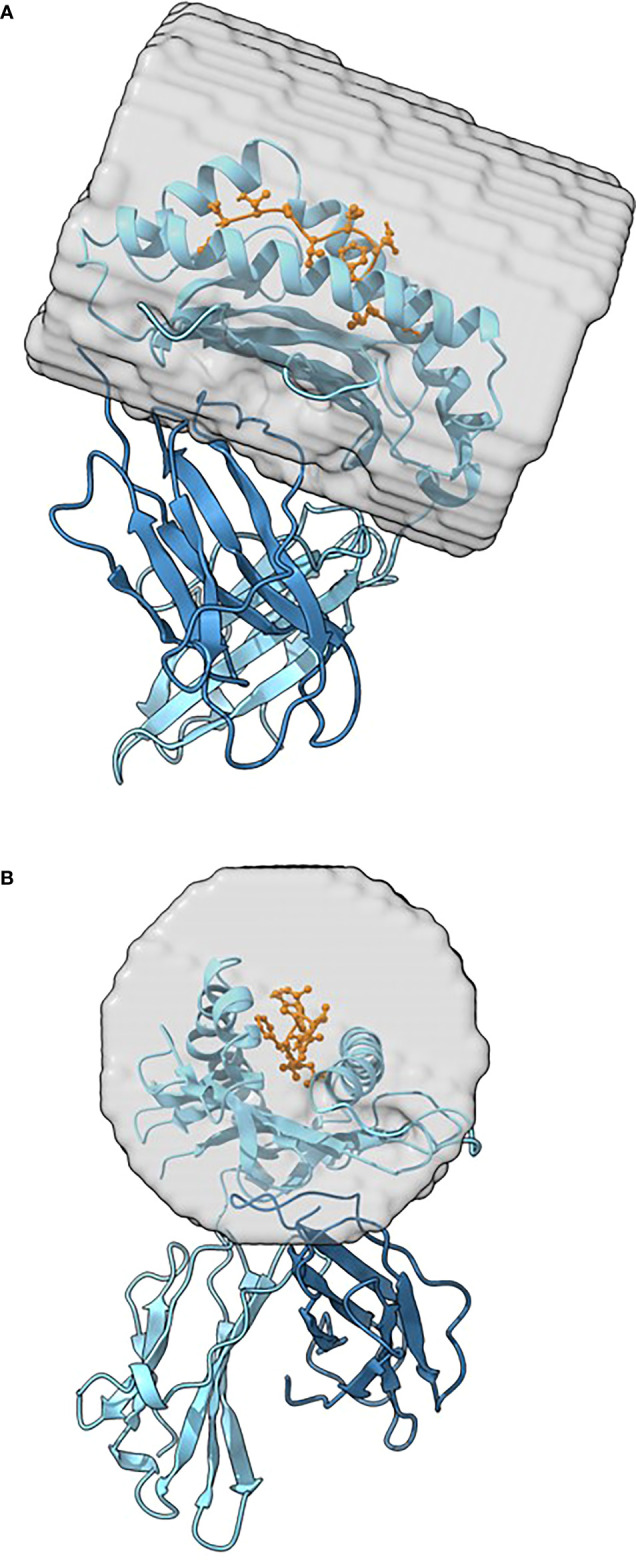
Figure 2.

Two different views of a pMHC showing the exact region and size of the cylindrical region used by PIPSA to compare MEPs between different pMHCs. The pMHC is shown in the representation with the alpha chain in light blue color, the beta chain in dark blue color, the epitope in orange with amino acid side chains in stick representation. The cylindrical region used for calculation is shown by a gray semi-transparent surface. The pMHC is shown from the top (A) and from the side (B). The pMHC depicted was modeled with the DockTope (28) tool using a dengue virus epitope as input.
