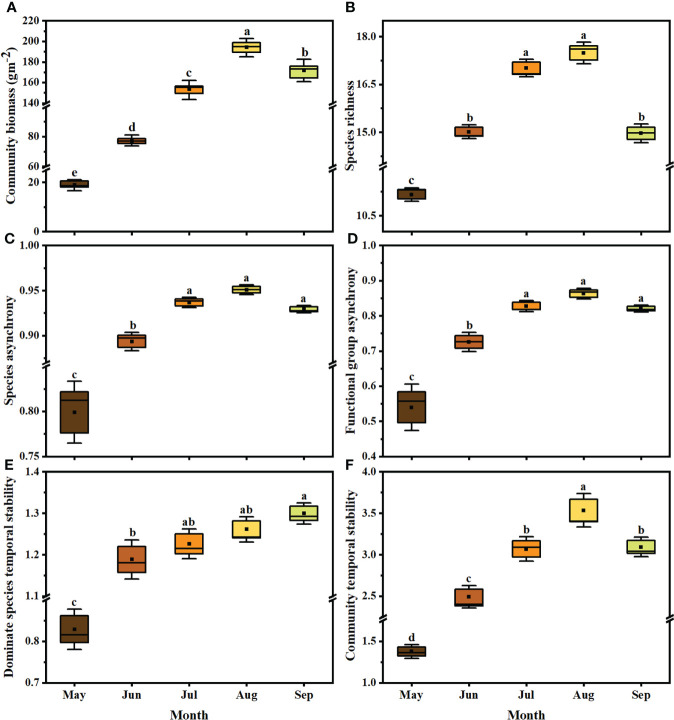
Figure 3.
Community biomass (A), species richness (B), species asynchrony (C), functional group asynchrony (D), dominant species temporal stability (E) and community temporal stability (F) during growing season between 1981 and 2011. Different colors represent the months from May to September (n = 10 each month). The significance of each factor in different months was tested by one-way ANOVA. In Tukey’s HSD’s multi-range test, the different letters at the top of each box represent significant differences between different months (P< 0.05). The boxes indicate the 25-75% confidence interval of each target variable. Solid lines and black squares inside the box represent the median and mean, respectively.

