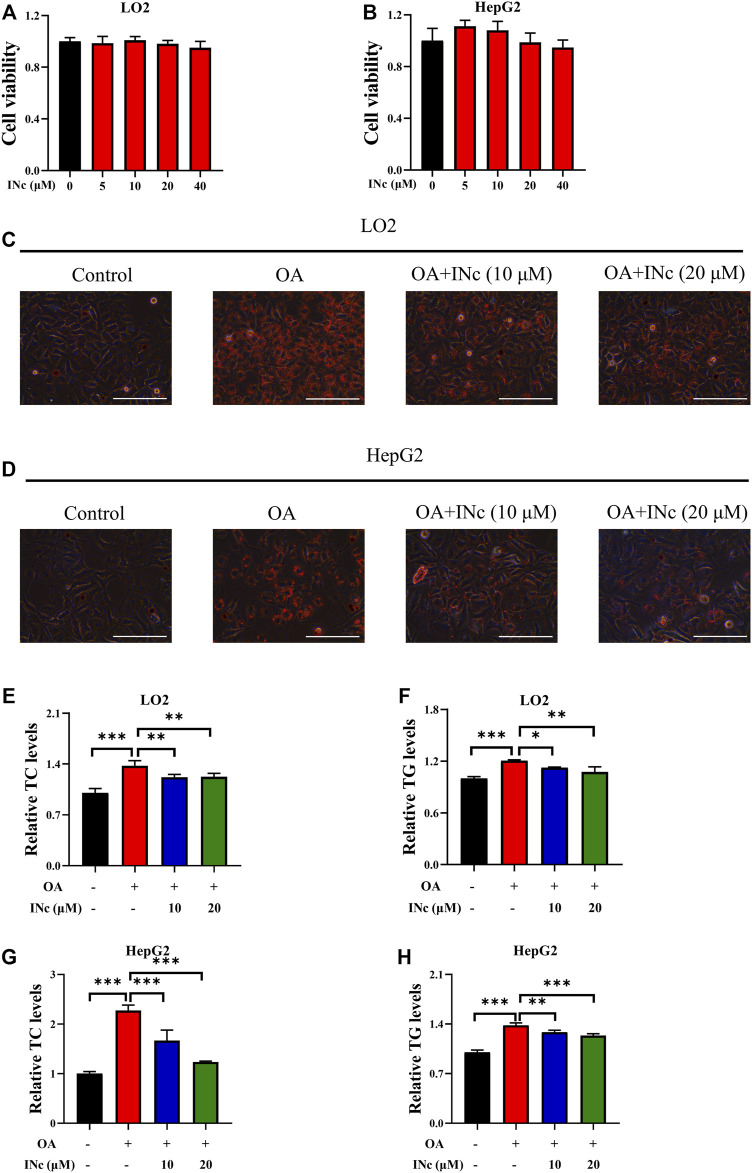
FIGURE 2.
BCATc Inhibition alleviates OA-induced hepatic steatosis. (A,B) LO2 and HepG2 cells were incubated with indicated concentrations of BCATc Inhibitor 2 for 48 h and MTT assay was performed. (C–H) LO2 and HepG2 cells were incubated with 0.5 mm Oleic acid and 0, 10, 20 µM BCATc Inhibitor 2 for 48 h. Intracellular lipid droplets were detected by Oil red O staining. Scale bar = 400 μM (C,D). Intracellular TC and TG levels in LO2 (E, F) and HepG2 (G–H) cells were detected. Data are shown as the mean ± SD of three independent experiments. *p < 0.05, **p < 0.01, ***p < 0.001. INc: BCATc Inhibitor 2.

