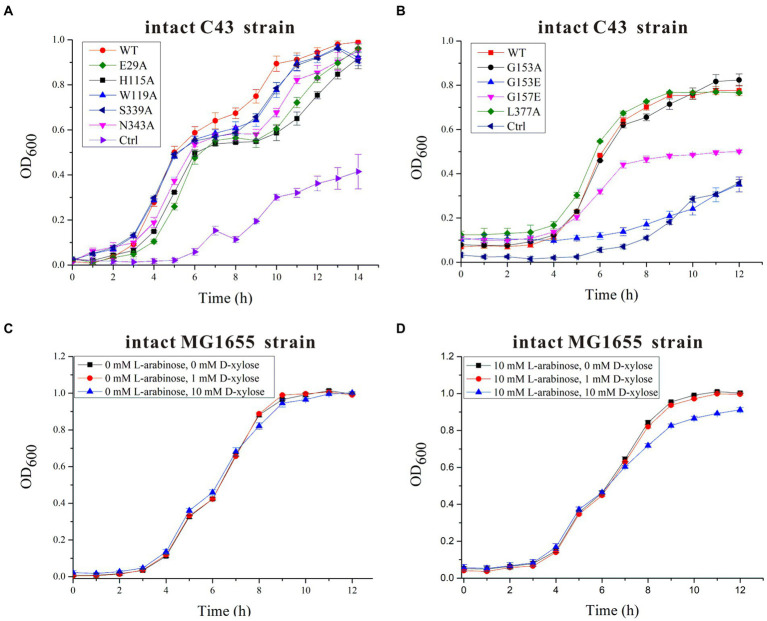
Figure 4.
Time-dependent Escherichia coli C43 and MG1655 growth assays in the presence of 10 mM L-arabinose and/or different concentrations of D-xylose. (A) The growth curves of intact E. coli C43 strain containing wild-type (WT) SotB or a given SotB mutant (E29A, H115A, W119A, S339A, and N343A) were measured in the presence of 10 mM L-arabinose. Cells transformed with the lipopolysaccharide signal transducer LapC in pET28a vector were used as control (ctrl); (B) The growth curves of intact E. coli C43 strain containing wild-type (WT) SotB or a given SotB mutant (G153A, G153E, G157E, and L377A) were measured in the presence of 10 mM L-arabinose. Cells transformed with the lipopolysaccharide signal transducer LapC in pET28a vector were used as control (ctrl); (C) The growth curves of the intact E. coli MG1655 strain were measured in the presence of different concentrations (0, 1, and 10 mM) of D-xylose; (D) The growth curves of the intact E. coli MG1655 strain were measured in the presence of 10 mM L-arabinose and different concentrations (0, 1, and 10 mM) of D-xylose. Data represented in graphs were collected from three biological replicates and presented as means ± standard deviations.

