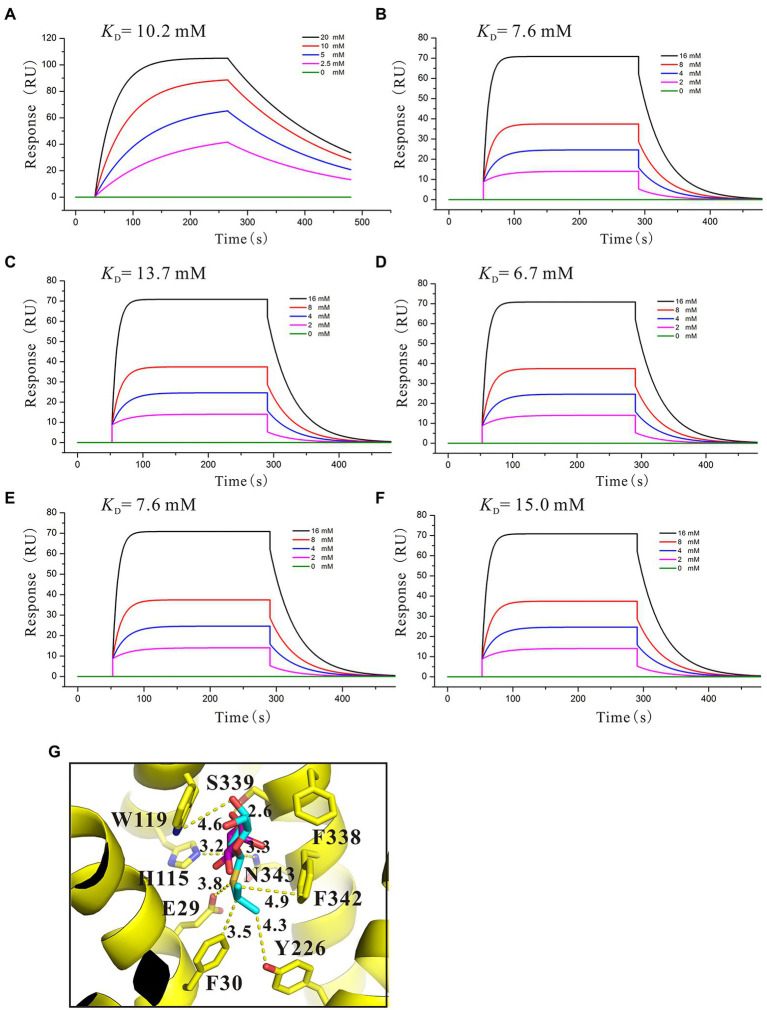
Figure 5.
Binding affinity analysis of IPTG with SotB/SotB variants. (A) Binding affinity of IPTG with SotB; (B) Binding affinity of IPTG with E29A; (C) Binding affinity of IPTG with H115A; (D) Binding affinity of IPTG with W119A; (E) Binding affinity of IPTG with S339A; (F) Binding affinity of IPTG with N343A. The colored lines represent the concentrations of IPTG used in SPR assays; (G) Coordination of IPTG by SotB. Hydrogen bonds are represented with yellow dashed lines. IPTG and docked L-arabinose are represented with cyan and purple sticks, respectively.

