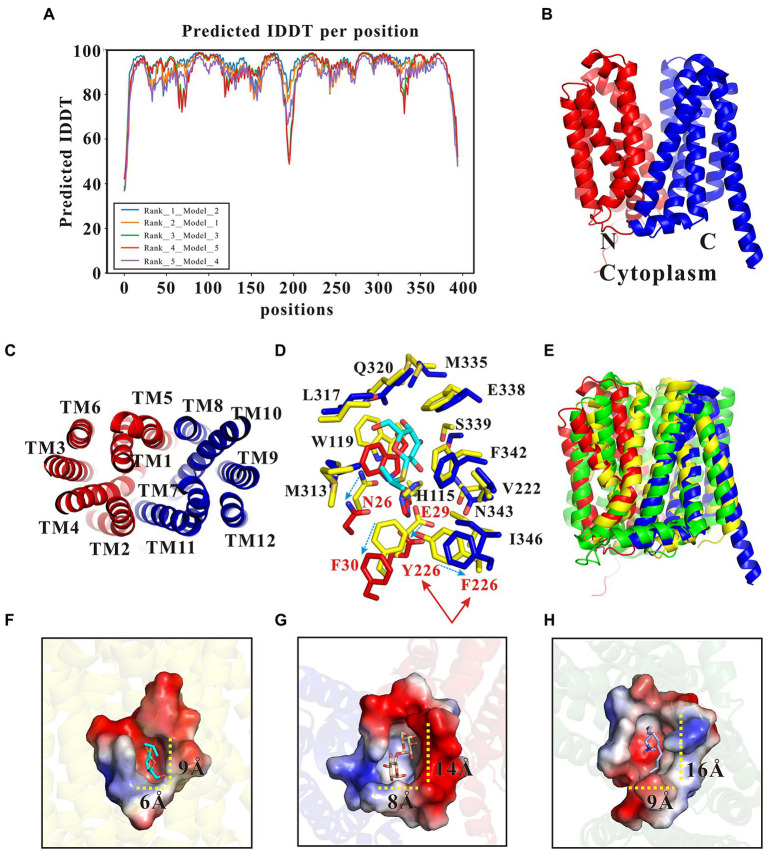
Figure 7.
Structural basis of functional differences between SotB and SotB2. (A) Five SotB2 structures were generated by the Alphafold 2 with a pIDDT 92.7% (rank_1_model_2), 91.3% (rank_2_model_1), 91.1% (rank_3_model_3), 90.7% (rank_4_model_5), and 88.6% (rank_5_model_4), respectively. The relationship between the reliability of the predicted structure and pIDDT: Very high (pIDDT > 90), Confident (90 > pIDDT > 70), Low (70 > pIDDT > 50), Very low (pIDDT < 50); (B) The overall structure of SotB2 (rank_1_model_2) predicted by AlphaFold 2. The N-terminal domain of SotB is shown as red cartoon and the C-terminal domain is shown as blue cartoon; (C) Top view of SotB2. TM segments are numbered; (D) The superimposition of the transport cavity of SotB and SotB2. The IPTG molecule in SotB structure is shown as cyan sticks. Amino acids from SotB are shown as yellow sticks. Amino acids from the N-terminal domain of SotB2 are shown as red sticks. Amino acids from the C-terminal domain of SotB2 are shown as blue sticks; (E) The superimposition of the overall structure of SotB (PDB ID: 6KKI), SotB2 (rank_1_model_2) and MdfA (PDB ID: 4ZP0); (F) The surface representation of transport cavity of SotB. The substrate IPTG molecule in SotB is shown as cyan sticks; (G) The surface representation of transport cavity of SotB2. The docked substrate melibiose molecule in SotB2 is shown as wheat color sticks; (H) The surface representation of transport cavity of MdfA. The substrate LDAO molecule in MdfA is shown as gray sticks. The 3D structures used in (F–H) are all belonged to the inward-occluded conformation.

