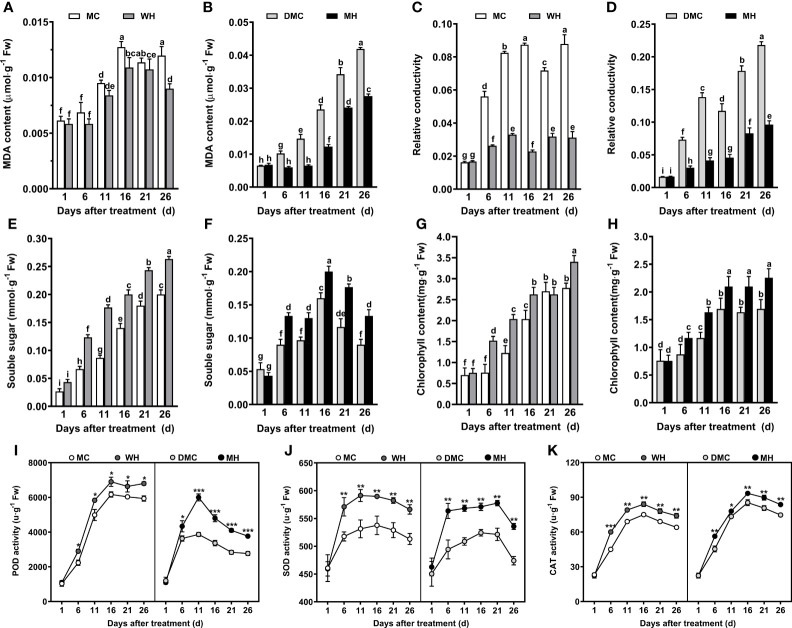
Figure 2.
Physiological and antioxidant system responses of maize to Sphingomonas sp. Hbc-6 on the 26th day after inoculation under four different treatments. Changes in (A, B) MDA content, (C, D) relative conductivity, (E, F) soluble sugar levels, and (G, H) chlorophyll content in maize during the following treatments: MC, WH, DMC, and MH. Time course of (I) POD, (J) SOD, and (K) CAT in response to Hbc-6. MC, non-inoculated (control) plants under normal conditions; WH, plants inoculated with Hbc-6 under normal conditions; DMC, non-inoculated (control) plants under medium drought; MH, plants inoculated with Hbc-6 under medium drought. Data are presented as mean ± standard deviation (SD) of three independent experiments (leaves from three plants). Different letters/asterisks indicate statistically significant differences (one-way analysis of variance, ANOVA; Duncan’s test; p < 0.05). *p < 0.05; **p < 0.01; ***p < 0.001.

