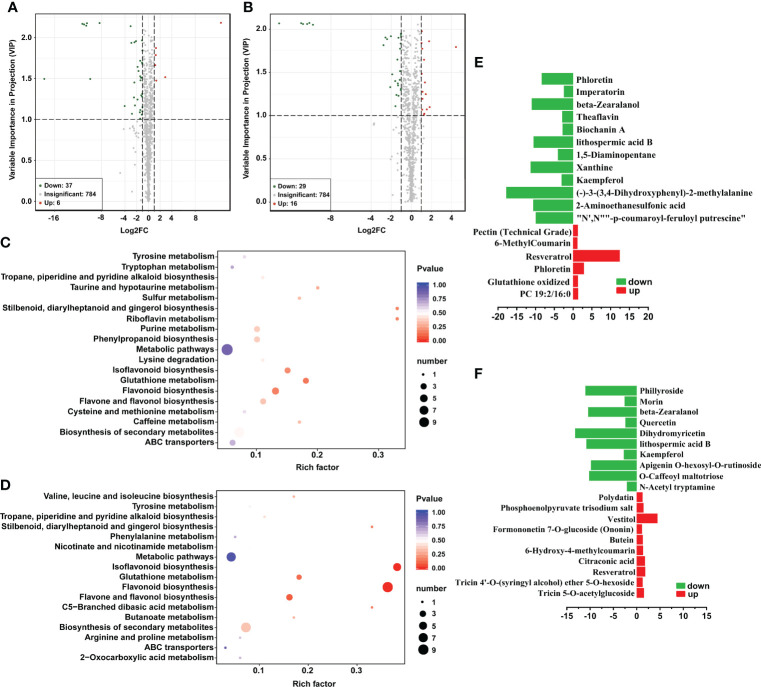
Figure 3.
Response of maize metabolites to Sphingomonas sp. Hbc-6 on the 26th day after inoculation under four different treatments. (A) Volcano plot on differential metabolites in maize of normal group (MC vs. WH) and (B) drought group (DMC vs. MH) of medium drought treatment. Kyoto Encyclopedia of Genes and Genomes (KEGG) classification of differential metabolites under normal (C) and medium drought (D) conditions. The abscissa represents the rich factor corresponding to each path, the ordinate is the pathname, and the color of the point is the p value. The red indicates that the enrichment is more significant. The size of the point represents the number of differential metabolites enriched: differential multiples of differentially expressed metabolites on normal (E) and medium drought (F) conditions. The abscissa represents the log2 (fold change), and the ordinate represents the name of metabolite. Red represents upregulated metabolites and green represents downregulated metabolites.

