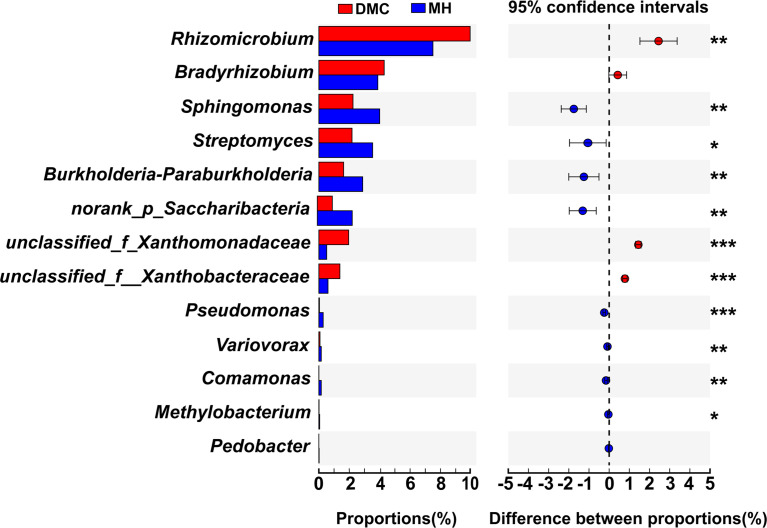
Figure 5.
Species difference abundance in rhizosphere soil of inoculated (with Hbc-6) and non-inoculated (control) plants under medium drought at the genus level. The abscissa represents different groups, boxes of different colors represent different groups, and the ordinate represents the average relative abundance of a species in different groups. Different asterisks indicate significant differences following Student’s t-test (*p < 0.05; **p < 0.01; ***p < 0.001).

