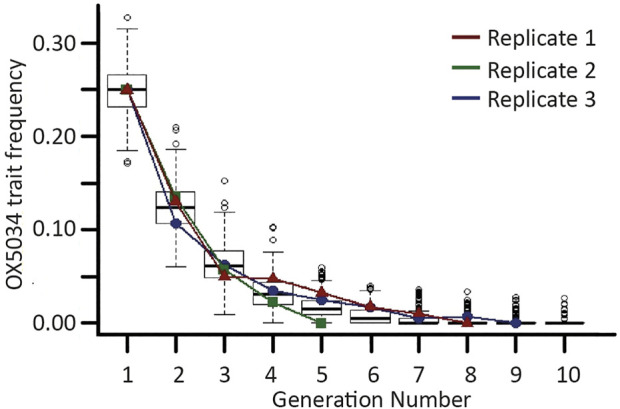
FIGURE 2.

Trait decline of OX5034 Aedes aegypti. Boxplots showing the results from 500 iterations of a stochastic model simulating the extinction of a male-selecting genetic trait under restrictive conditions (off-doxycycline rearing). Horizontal bold lines represent generational medians; upper and lower box lines represent first and third quartiles, respectively; outer horizontal lines represent 1.5× the interquartile range; and open circles represent data points over 1.5× above or below the first and third quartiles. Overlaid onto the box plots are lines (red, blue and green) showing male-selecting trait frequency changes from three replicates of caged experiments. Generation 1 represents a post-field release population with a trait frequency of 0.25.
