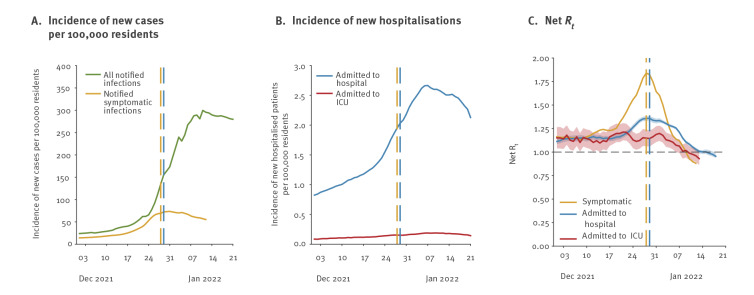
Figure 3.
The impact of Omicron spread on SARS-CoV-2 circulation, Italy, December 2021–January 2022
ICU: intensive care unit; Omicron: Phylogenetic Assignment of Named Global Outbreak (Pango) lineage B.1.1.529; SARS-CoV-2: severe acute respiratory coronavirus 2.
A. Time series of total number of notified and symptomatic cases by date of notification and symptom onset (moving average over 7 days), respectively. The number of symptomatic cases by date of symptom onset is shown only for data consolidated on 21 January 2022.
B. Time series of total number of cases admitted to hospital and to ICU, by date of admission (moving average over 7 days).
C. Net reproduction numbers Rt for symptomatic cases, cases admitted to hospital and to ICU, respectively in yellow, blue and red. The solid line represents the mean of the estimated posterior distribution, and the shaded areas delimit 95% credible intervals.
The yellow and blue dashed vertical lines represent the days at which the net reproduction numbers for symptomatic and hospitalised cases respectively reach their peak values, as shown in panel C.

