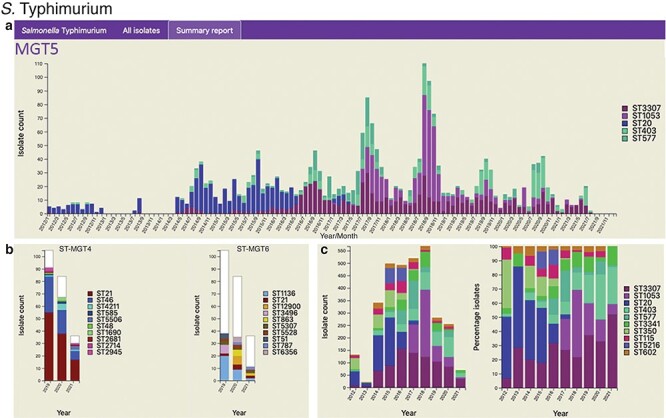
Figure 3.

Static charts from the report feature on MGTdb which enables national surveillance. For any country, or any user’s project (which houses a set of isolates), a report can be generated. The report presents isolates (and MGT assignments), within a specified country or project for a specified range of years, as general summaries, as well as, summarizes the isolates at each individual MGT level as a series of graphs. Shown here are graphs from the report generated for S. Typhimurium MGT5 STs in the UK over the past 10 years (2012–21). In particular, (a) summary of top five MGT5 STs by month, (b) summary of MGT5 ST3307 isolates at the MGT4 and MGT6 levels, and (c) summary of top 10 MGT5 STs by year, where the first graph shows isolate counts, and in the second, the counts have been scaled by the maximal ST distribution observed that year. These data can be explored on MGTdb at https://mgtdb.unsw.edu.au/salmonella/summaryReport by choosing the country ‘UK, setting the ‘Year start’ as 2012, ‘Year end’ as 2021, and then generating the report.
