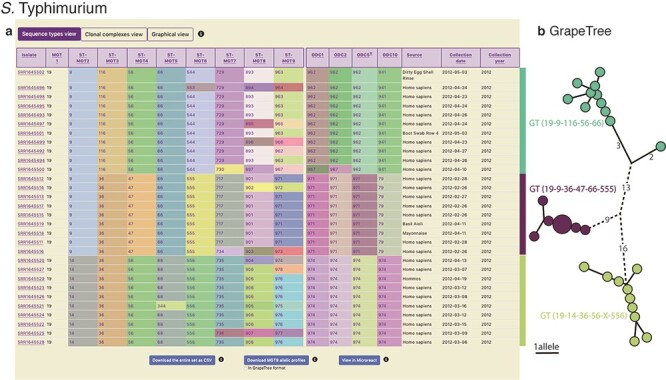
Figure 4.

Display of all data in MGTdb and exported data enabling streamlined integration with GrapeTree. (a) All isolates—initially loaded or filtered—are shown in an interactive table. Shown in the table are also the STs assigned to the isolates at all MGT levels and ODCs. This view can be switched to visualize CCs, instead of STs, for all MGT levels, using buttons above the table. The CCs group STs by single linkage clustering with a one allele difference cut-off, and ODCs group the largest MGT-level STs, with 1, 2, 5 and 10 allele difference cut-offs. The table shows a maximum of 100 isolates per page. To summarize all the initially loaded or filtered data, a user can switch to graphical view (button displayed above the table), or download the data (using buttons below the table). The user can download the data displayed in the table (MGT-associated assignments), allelic profiles for the largest MGT level, or export the data to Microreact. (b) GrapeTree visualization of isolates exported from MGTdb. The allelic profiles and the MGT assignments can be imported into GrapeTree to build and visualize a neighbour joining graph (as shown here), or a minimal-spanning tree. The data shown in the table and the GrapeTree network graph are from three outbreaks of S. Typhimurium that occurred in NSW, Australia, in 2012 and can be explored on MGTdb at: https://mgtdb.unsw.edu.au/salmonella/isolate-list?year=2012&state=NSW&searchType=and.
