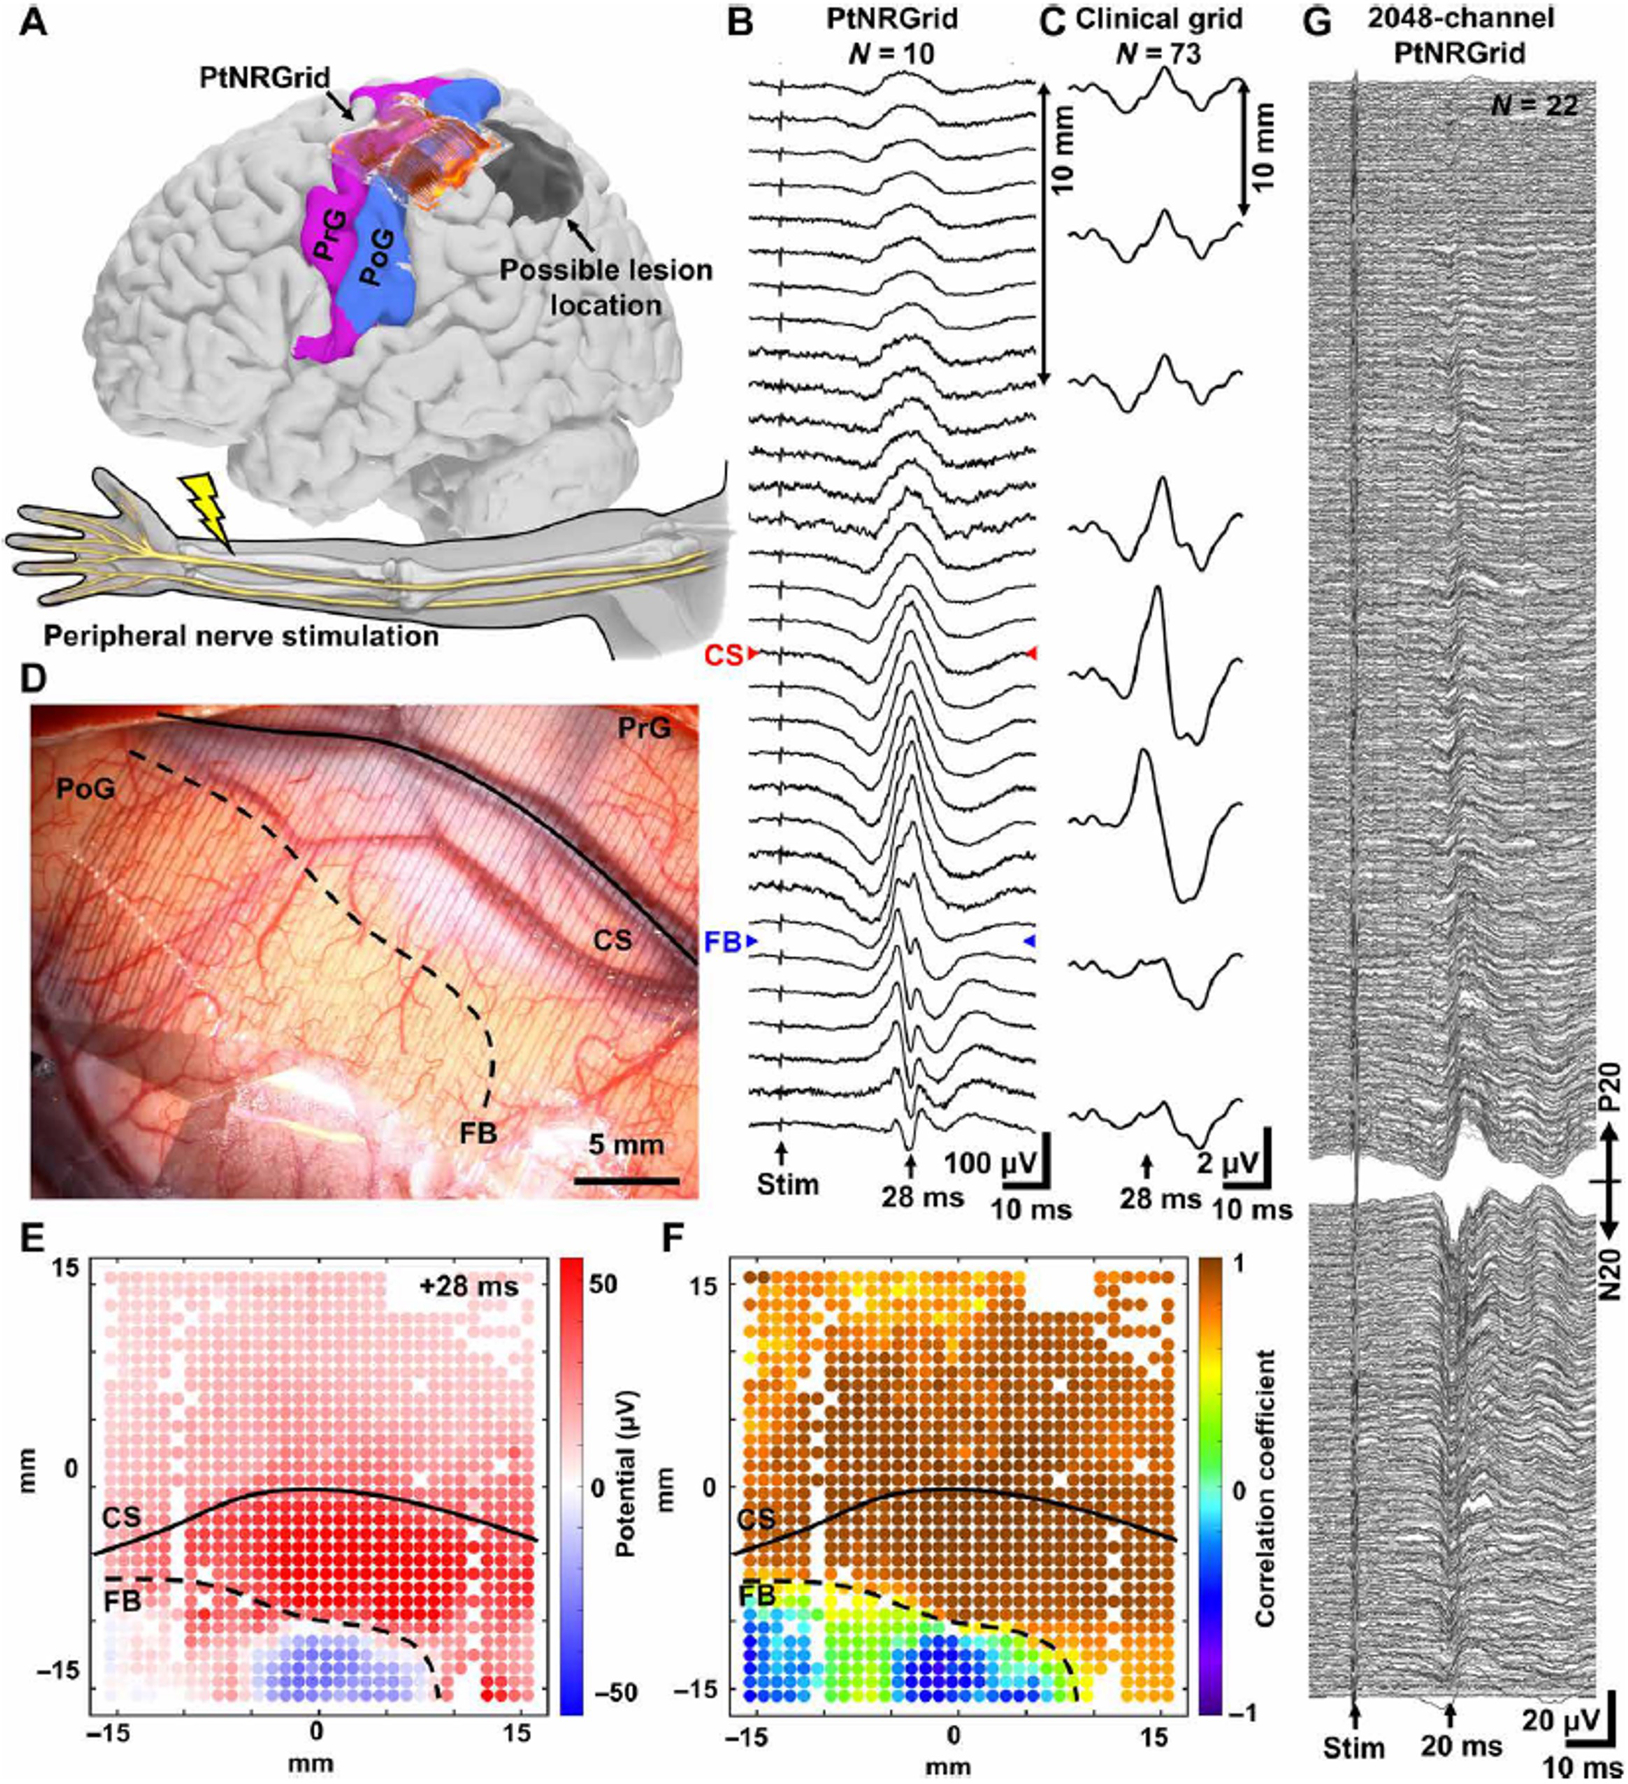
Fig. 3. Mapping the curvilinear nature of the functional sensory/motor regions in the human brain with millimeter resolution.

(A) Reconstructed model of the patient’s brain and the electrode implantation locations. Electrodes were implanted near the hand region, and the peripheral nerve was electrically stimulated. Somatosensory evoked potential (SSEP) waveforms along a line across the central sulcus (CS) and M1-S1 functional boundary (FB) recorded with (B) 32×32 PtNRGrid with 1 mm spacing and (C) 2×8 clinical grid with 10 mm spacing. (D) Implantation picture of the electrodes near the hand region. (E) 1024-channels potential mapping of the stim-evoked waves 28 ms after the stimulation (as opposed to 20 ms due to distortion from brain lesion as shown in panels (B) and (C). (F) Correlation coefficient mapping with respect to the waveforms measured with respect to the channel in the center of the grid. (G) Human brain SSEPs from 2048 channel PtNRGrid. Channels are sorted according to the peak potential amplitude and polarity at 20 ms after the stimulation, and channels with high contact impedance were excluded from the plot.
