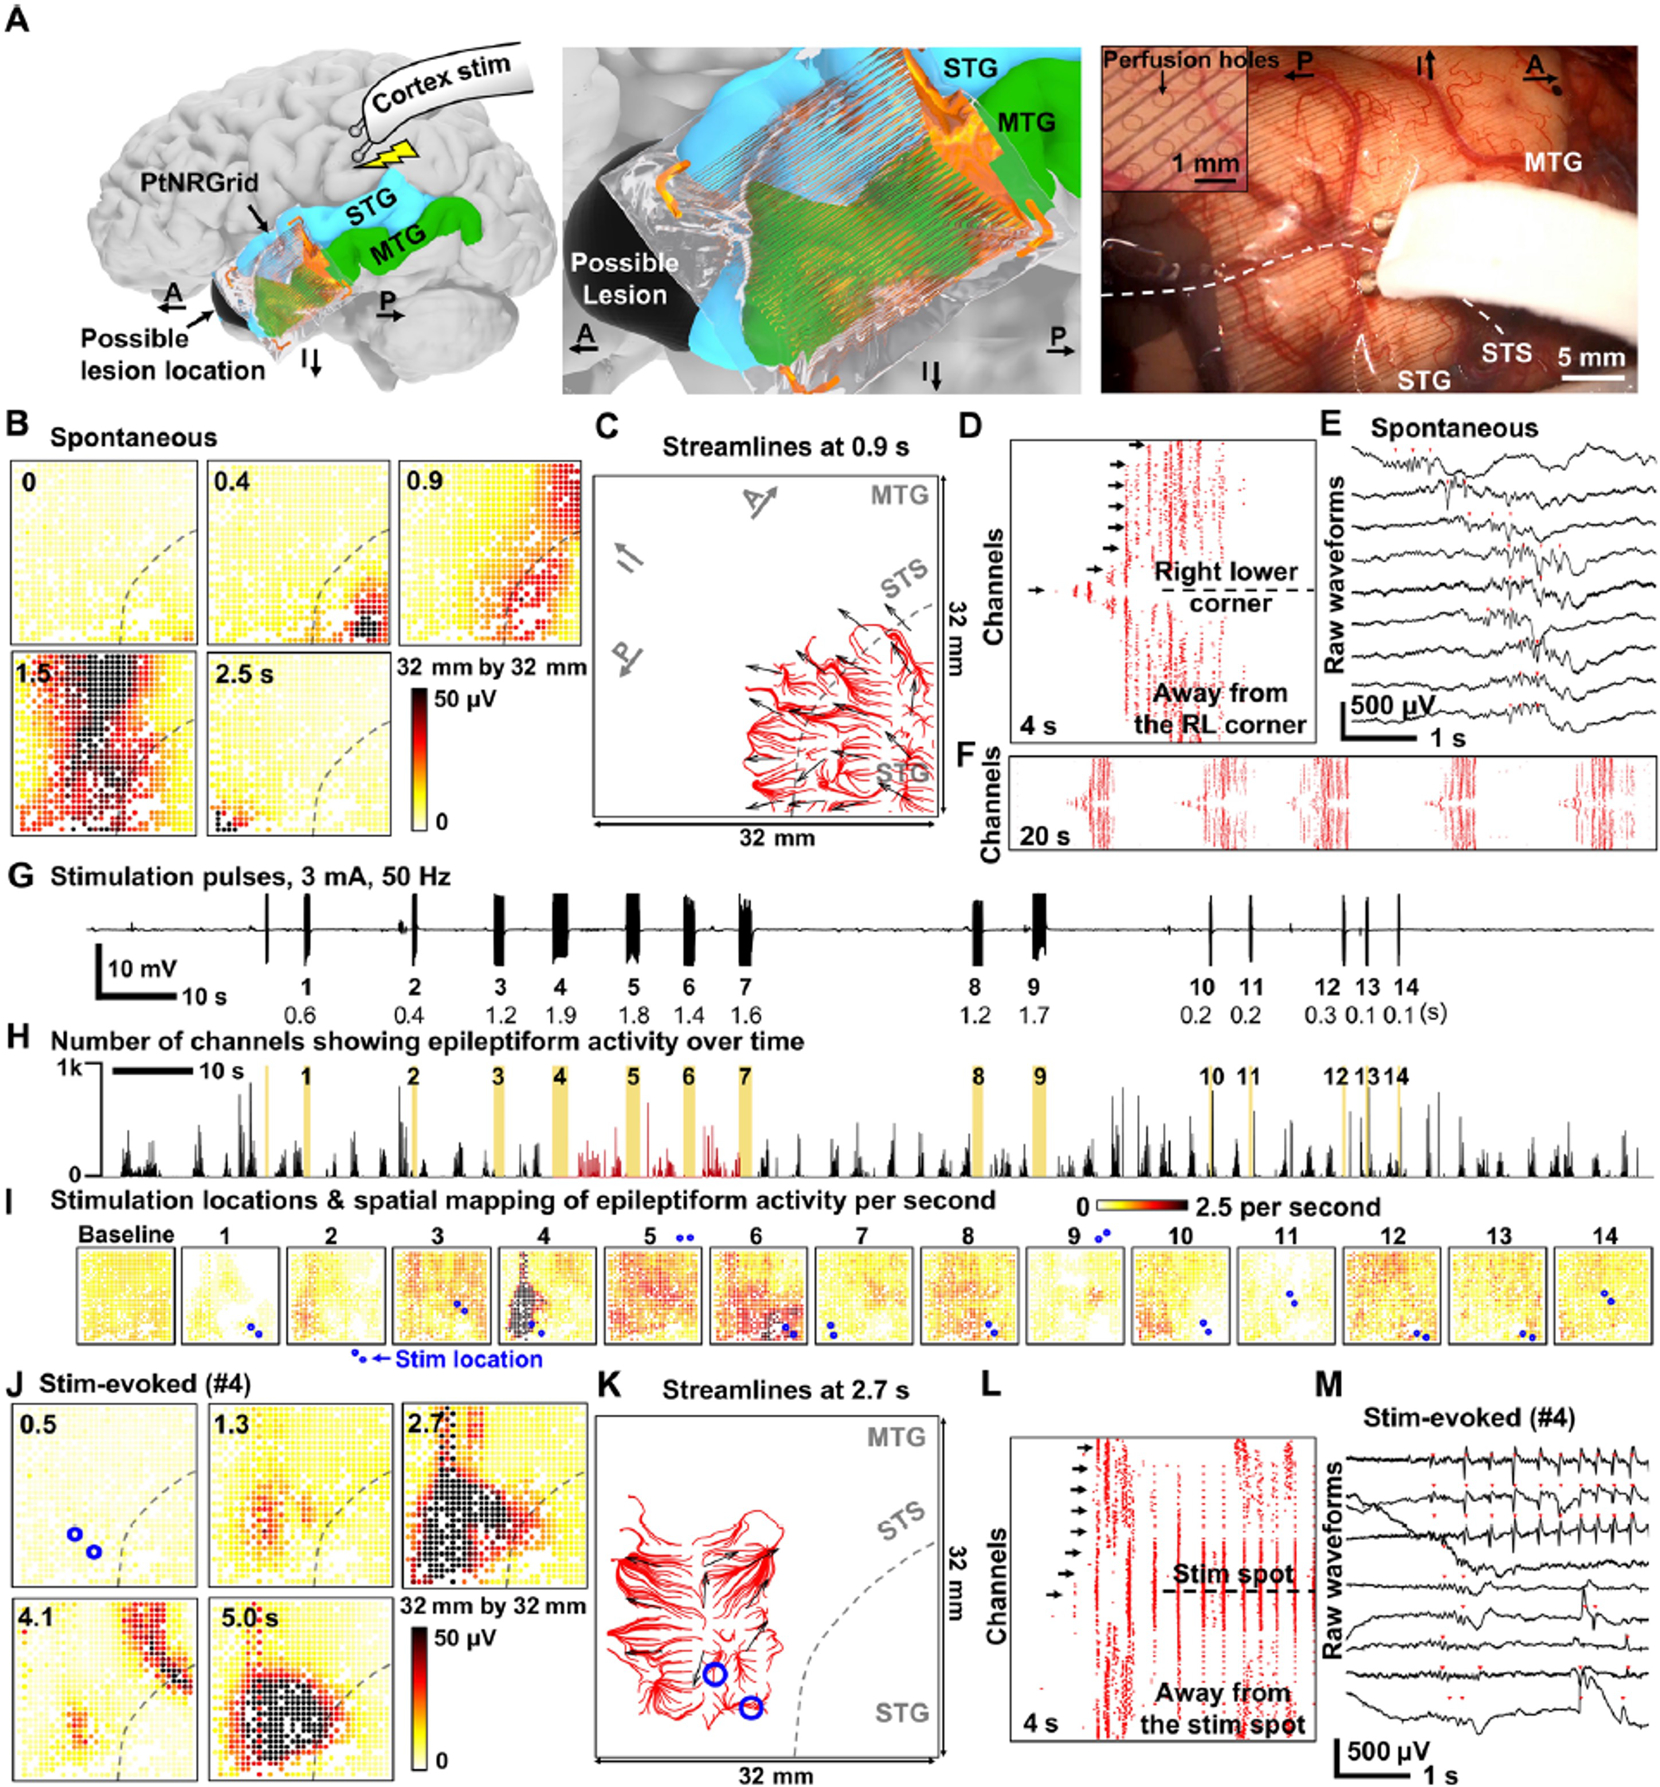
Fig. 5. Pathological mapping with millimeter resolution: PtNRGrids reveal detailed spatiotemporal dynamics of spontaneous and stimulated epileptiform discharges from an epilepsy patient.

(A) (Left) Reconstructed model of electrode placement on the temporal lobe of the patient’s brain, and the schematics of charge-balanced bi-phasic direct current stimulation with the bipolar (Ojemann) probe. (Middle) Magnified model near the electrode. (Right) Photo showing the cortical tissues directly being stimulated through the electrode. Inset is a magnified image showing the 0.5 mm diameter perfusion holes that are distributed at a 1mm pitch on the electrode allowing direct current stimulation at any point on the grid. Positions of the superior temporal sulcus (STS), superior temporal gyrus (STG), and middle temporal gyrus (MTG) are marked on the photo. Anatomical orientation arrows indicate anterior (A), posterior (P), and inferior (I). (B)-(F) Spontaneous epileptiform discharges. (B) Spatial mapping of the 10–59 Hz spontaneous brain wave amplitude. Location of STS is marked with dotted lines. (C) Streamlines plot at 0.9 s depicting the spontaneous propagating wave together with the vectors indicating the direction of propagating waves. Automatically detected epileptiform discharges for all channels in (D) 4s and (F) 20s time windows. (E) Raw waveforms selected from arrow marked channels of (D). The channels are sorted according to the distance from the right lower corner of the electrode; the channel in the midline is closest to the lower right corner. (G) Time course and recordings of the stimulation pulse artifacts for time-locking with evoked response. The stimulation sequence number and duration of stimulation time is indicated below the waveforms. (H) Number of channels showing epileptiform discharges over time. The yellow color indicates the stimulation time points, and the red colored regions mark significant enhancement in epileptiform discharges detection for stimulations number 4, 5 and 6 (p < .001). (I) Spatial mapping of epileptiform discharge rate after each stimulation trial. Stimulation locations on or near the electrode are indicated by pair of blue dots for the 14 stimulation trials. (J)-(M) Stimulation evoked epileptiform discharges, similar to (B)–(F). (J) Spatial mapping of the 10–59 Hz stim-evoked brain wave amplitude. (K) Streamlines plot at 2.7 s depicting the stim-evoked propagating wave together with the vectors indicating the direction of propagating waves. (L) Automatically detected epileptiform discharges for all channels in a 4 s time window. The channels are sorted according to the distance from the stimulation point. (M) Raw waveforms selected from arrow marked channels of (L). Propagating waves for (C) spontaneous epileptiform discharge and (K) stimulation-evoked epileptiform discharge. The red streamlines for (C) originate from the right lower corner while those for (K) originates near the stimulation location. The blue circles in (K) are the bipolar stimulator contact points on the cortex.
