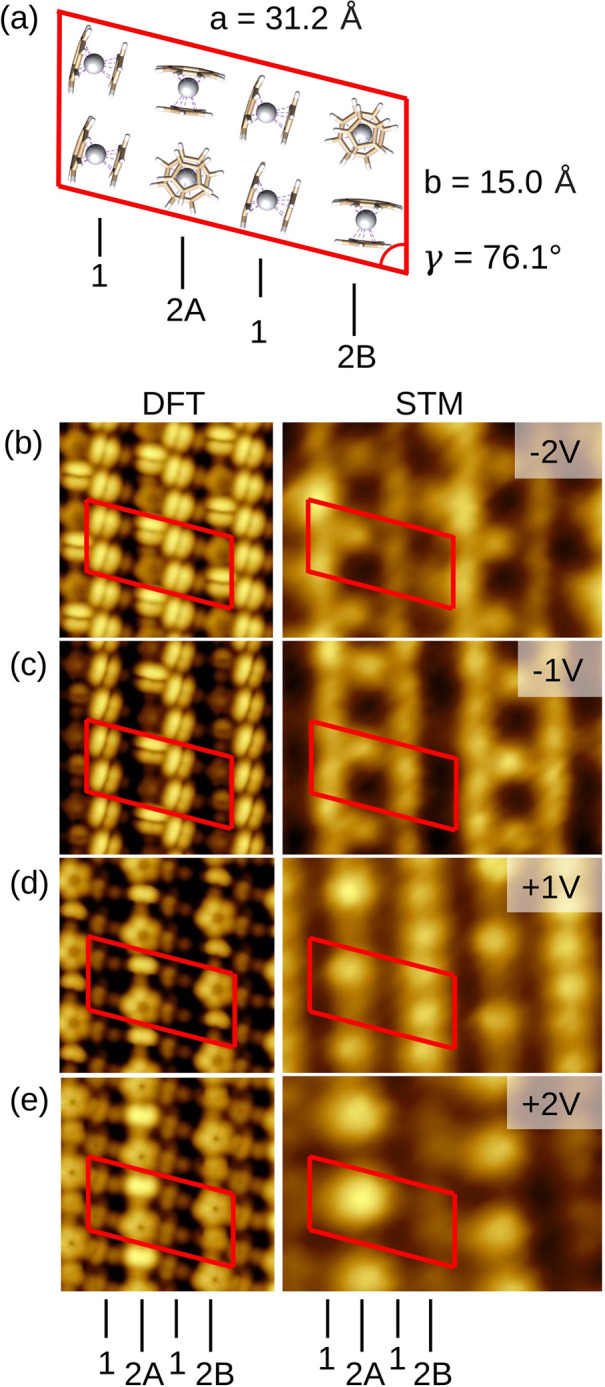
Figure 3.

(a) Cell employed in the [CpTi(cot)]@Au optimization having six lying and two standingcot molecules. Rows of molecules in the lying disposition are labeled 1, while rows presenting alternating standing and lying arrangements on the surface are labeled 2A and 2B. Panels b–e depict the simulated, left, and experimental STM images, right, of the [CpTi(cot)]@Au layer as a function of the bias voltage, Vb. Simulations: 4.5 × 4.5 nm2, Vb = −2 V (b), −1 V (c), +2 V (d), +3 V (e). Experiment: 5.3 × 3.9 nm2, It = 20pA, Vb = −2 V (b), −1 V (c), +1 V (d), +2 V (e). Negative biases represent the sample’s filled states, and positive biases represent the empty ones. The unit cell and row labeling shown in (a) are marked as a guide to the eye.
