
Figure 4.
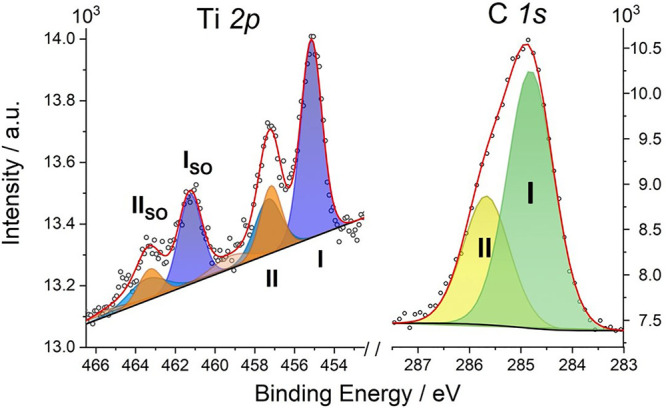
XPS core-level spectra of [CpTi(cot)] on the Au(111) surface in the Ti 2p and C 1s regions. Labels I and II indicate the main components of each spectral region, as discussed in the text. The spin–orbit components are labeled “SO”.
Official websites use .gov
A
.gov website belongs to an official
government organization in the United States.
Secure .gov websites use HTTPS
A lock (
) or https:// means you've safely
connected to the .gov website. Share sensitive
information only on official, secure websites.
XPS core-level spectra of [CpTi(cot)] on the Au(111) surface in the Ti 2p and C 1s regions. Labels I and II indicate the main components of each spectral region, as discussed in the text. The spin–orbit components are labeled “SO”.