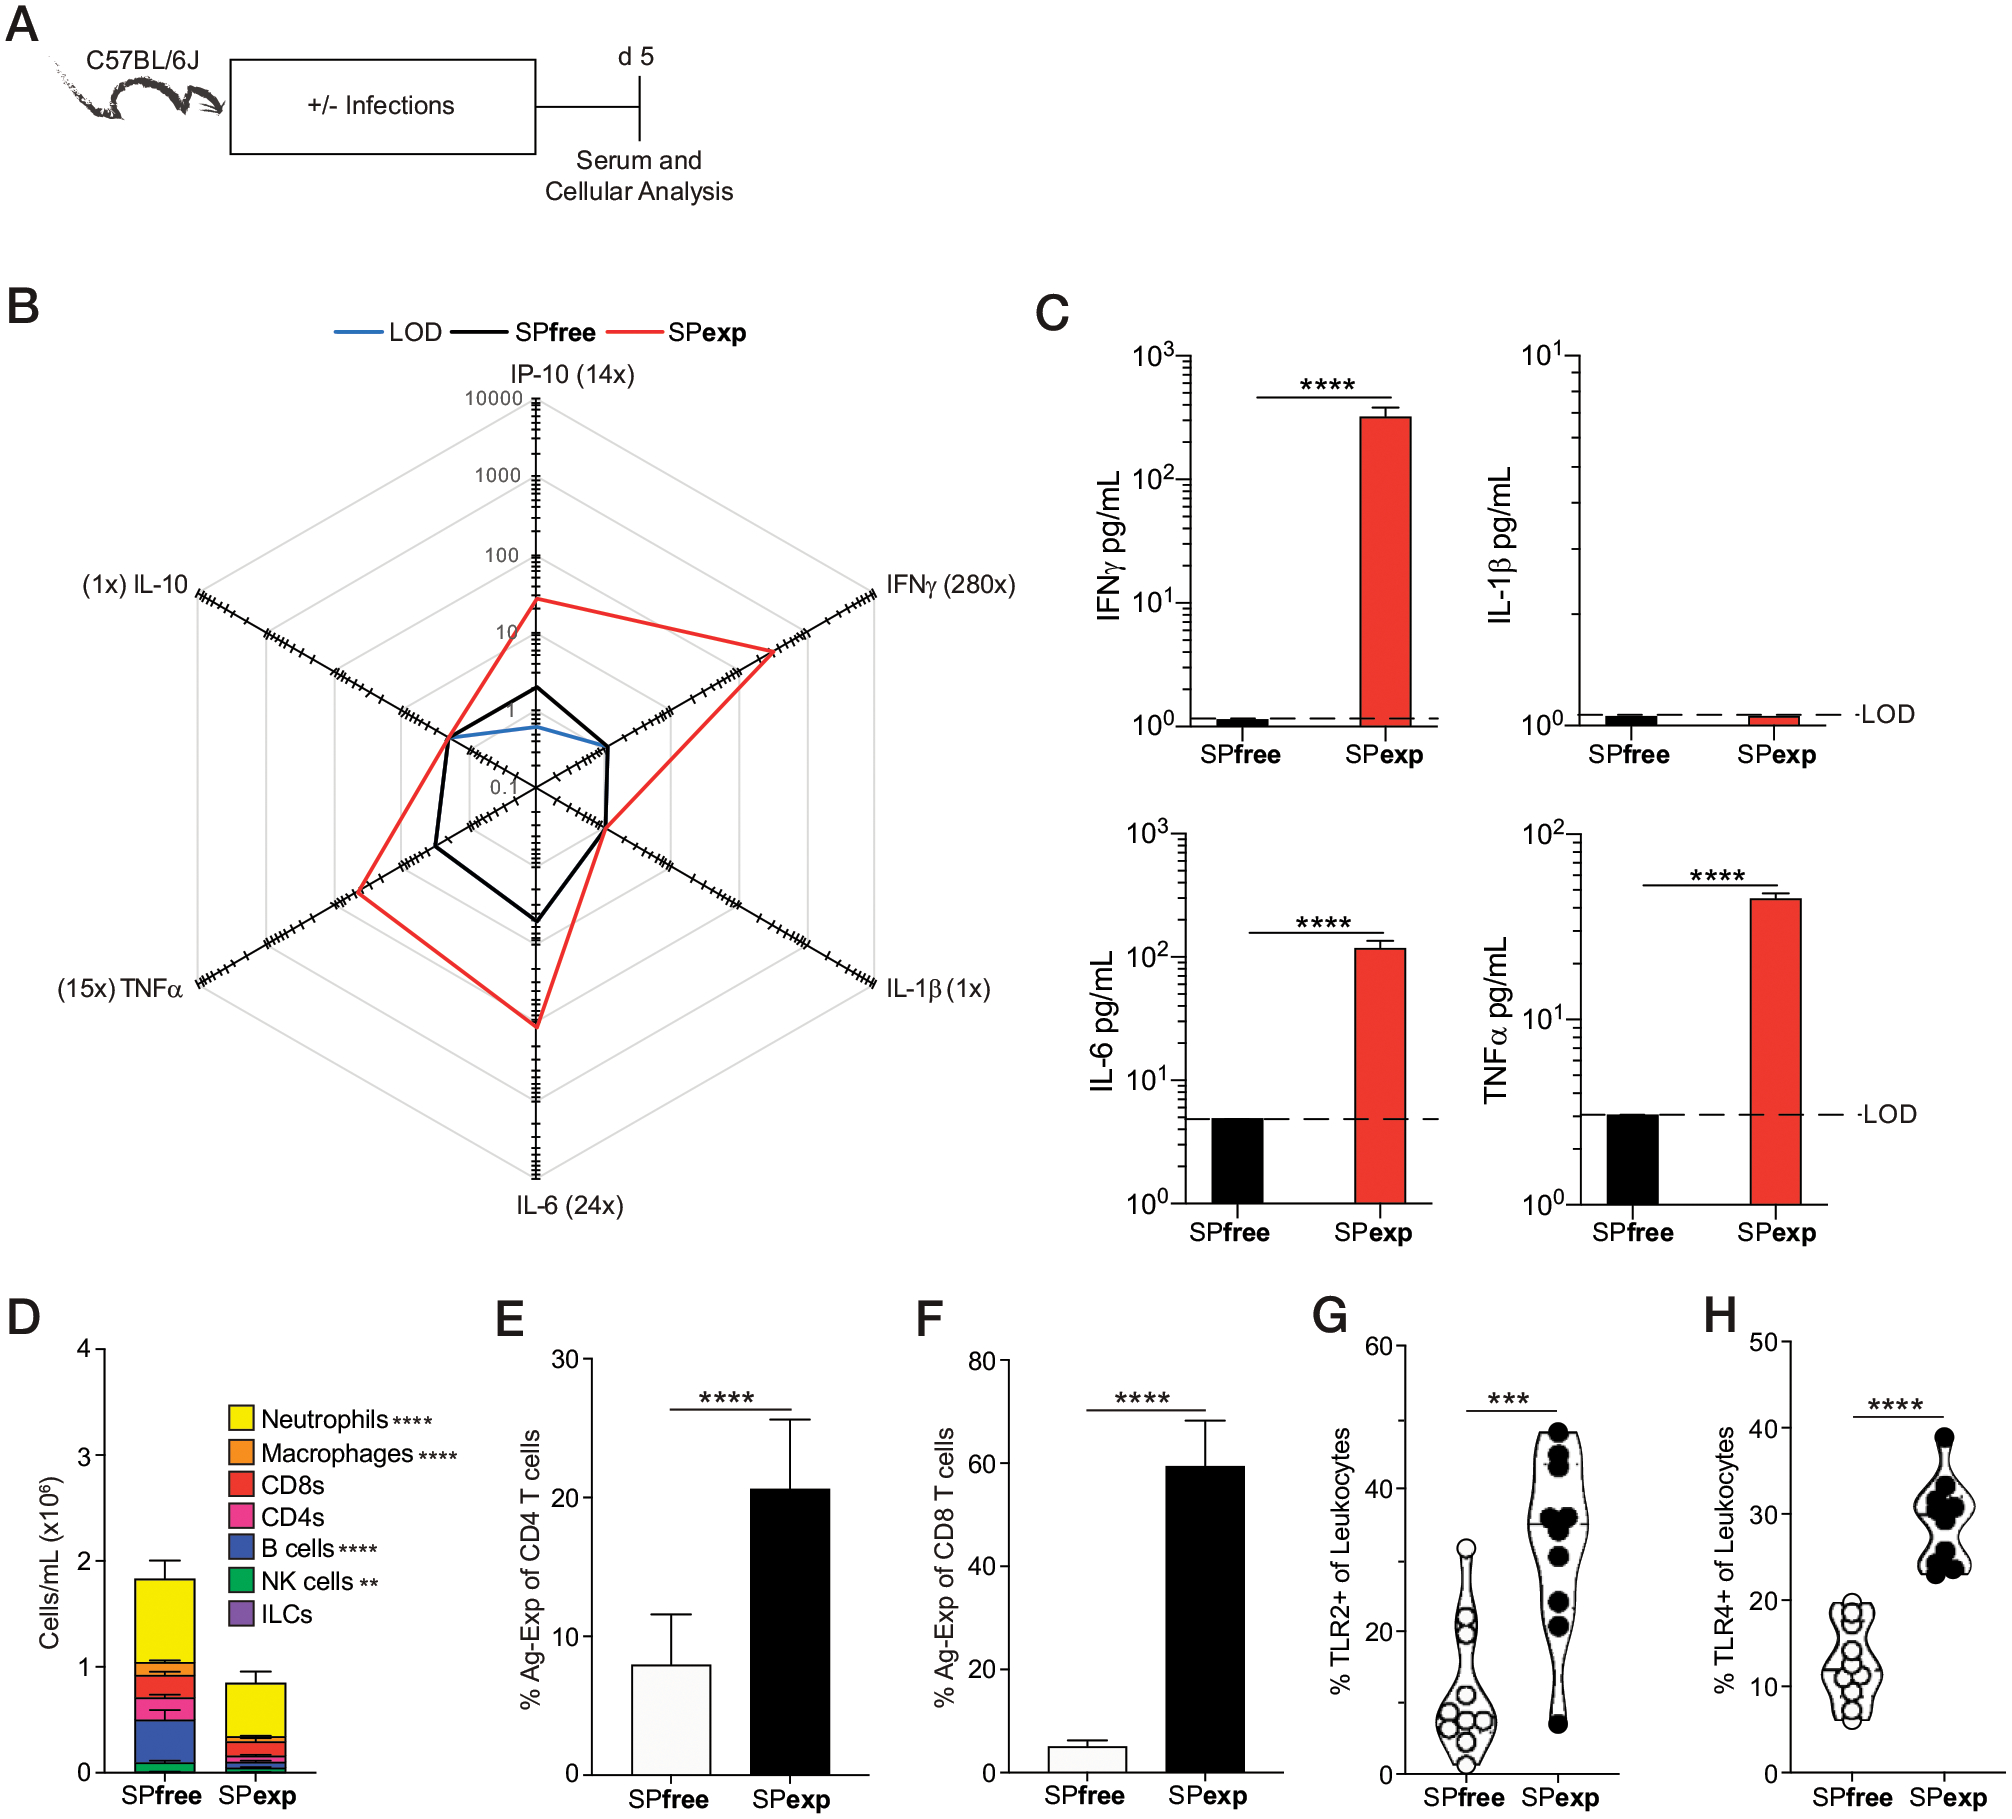
FIGURE 2. Sequential infection leads to increased inflammation and alters cellular composition and phenotype.

(A) Experimental design. Serum and PBLs were collected from SPexp and age-matched SPfree B6 mice 5 d after last infection. (B) Summary data of analyte levels 5 d after last infection. Concentrations are in pg/ml. Parentheses indicate fold difference between experimental groups. (C) IFN-γ, IL-1β, IL-6, and TNF-α concentrations in SPfree and SPexp mice 5 d after last infection. (D–H) Number of cells per milliliter of PBL (D), frequency of Ag-experienced (E) CD4 and (F) CD8 T cells, and frequency of (G) TLR2- and (H) TLR4-expressing leukocytes 5 d after last infection. Data are representative of at least three independent experiments with 10 mice per group. Error bars represent SEM. **p < 0.01, ***p < 0.001, ****p < 0.0001.
