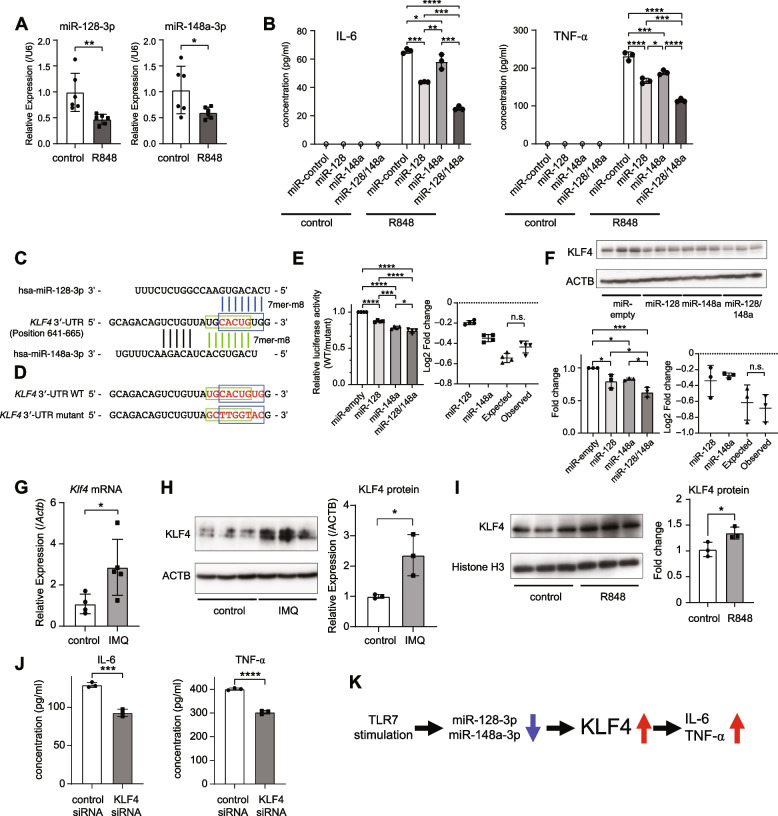
Fig. 2.
Negative regulation of inflammatory responses by miR-128-3p and miR-148a-3p through combinatorial suppression of KLF4. A Relative expression of miR-128-3p and miR-148a-3p in CAL-1 cells treated with R848 for 72 hours (N = 6, **P < 0.01, two-tailed Wilcoxon rank sum test). B Effect of miRNA overexpression on R848-induced cytokine production in CAL-1 cells. At 24 h after transfection with miRNAs (Additional file 1: Fig. S3A), CAL-1 cells were stimulated by R848 for 24 h and subjected to ELISA to determine the concentrations of IL-6 (left) and TNF-α (right) in the supernatant (control: N = 1, R848: N = 3, *P < 0.05, **P < 0.01, ***P < 0.001, ****P < 0.0001, one-way ANOVA and post hoc Tukey test). C Sequence alignments of miR-128-3p, miR-148a-3p, and their putative binding sites in the KLF4 3′ UTR. The seed complementary site for each miRNA is indicated by a rectangle (blue: miR-128-3p, green: miR-148a-3p). The overlap sequence is highlighted in red. D WT and mutant target sites of KLF4 3′ UTR used for luciferase reporter assay. E Combinatorial effects of miR-128 and miR-148a overexpression on KLF4 3′ UTR, as determined by luciferase reporter assay in HeLa cells. HeLa cells were transfected with 3′ UTR reporter plasmid, pRL-TK plasmid, and empty or pri-miRNA expression plasmids and subjected to luciferase assay. Relative luciferase activities for WT 3′ UTR were normalized by those for mutant 3′ UTR (left). The right panel shows the comparison of log2 fold change of expected repression (log2-additive) and observed repression. Data are means ± SD. Each dot represents the mean of five biological replicates in four independent experiments (*P < 0.05, ***P < 0.001, ****P < 0.0001, one-way ANOVA and post hoc Tukey test (left); n.s., not significant, two-tailed Wilcoxon rank sum test (right)). F Effects of miR-128 and miR-148a overexpression on KLF4 protein levels in HeLa cells. HeLa cells were transfected with pri-miRNA empty or overexpression plasmids. At 48 h after transfection (Additional file 1: Fig. S3B), western blotting analyses were performed (a representative image in the left panel). The right panel shows the comparison of log2 fold change of expected repression (log2-additive) and observed repression. Each dot represents the mean of a biological triplicate in three independent experiments (*P < 0.05, ***P < 0.001, one-way ANOVA and post hoc Tukey test (left); n.s., not significant, two-tailed Wilcoxon rank sum test (right)). G Relative expression of Klf4 mRNA in pDCs of 4-week-old IMQ mice. Data are means ± SD (control: N = 4, IMQ: N = 5, *P < 0.05, two-tailed Wilcoxon rank sum test). H Western blotting analysis of KLF4 protein levels in pDCs from IMQ and control mice. Data are means ± SD (N = 3 per group, *P < 0.05, two-tailed Student’s t-test). I Western blotting analysis of KLF4 expression in CAL-1 cells stimulated with R848 for 72 h. Data are means ± SD (N = 3 per group, *P < 0.05, two-tailed Student’s t-test). J Effect of KLF4 knockdown on the inflammatory response. CAL-1 cells were transfected with control siRNA and siRNA for KLF4. At 24 h after transfection, cells were stimulated by R848 for 24 h and subjected to ELISA to determine the concentrations of IL-6 (left) and TNF-α (right) in the supernatant. Data are means ± SD (N = 3 per group, ***P < 0.001, ****P < 0.0001, two-tailed Student’s t-test). K Summary of the contribution of the miR-128/148a-KLF4 axis in pDCs to SLE pathogenesis

