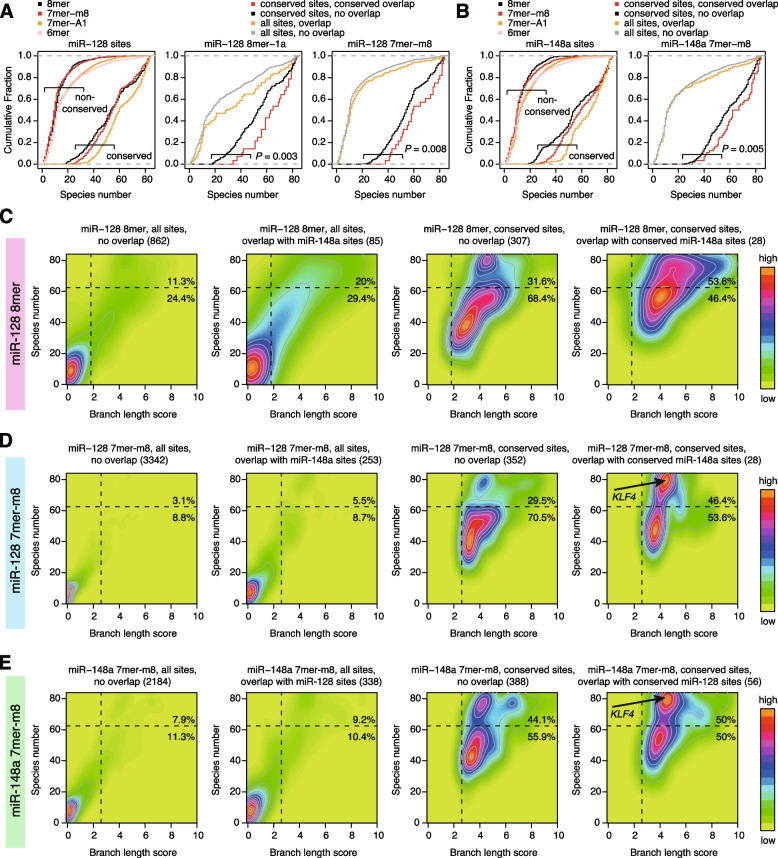
Fig. 4.
Conservation trends of miR-128 and miR-148a target sites with “conserved overlap.” A, B Cumulative distribution of the number of species in which the indicated site types of miR-128-3p (A) and miR-148a-3p (B) are conserved across 84 species. Conserved and non-conserved sites are defined by TargetScan. Target sites are classified according to Fig. 3A. P values were calculated by the one-tailed Wilcoxon rank sum test. C–E Density and contour plots showing the distribution of BLS values and the number of species in which sites are conserved. The results for all sites with no overlap, all sites with overlap, conserved sites with no overlap, and conserved sites with “conserved overlap” of miR-128-3p 8mer (C), miR-128-3p 7mer-m8 (D), and miR-148a-3p 7mer-m8 (E) are shown. Vertical and horizontal dashed lines indicate BLS cutoffs and the species number threshold (n = 62), respectively. Numbers in parentheses are the numbers of target sites

