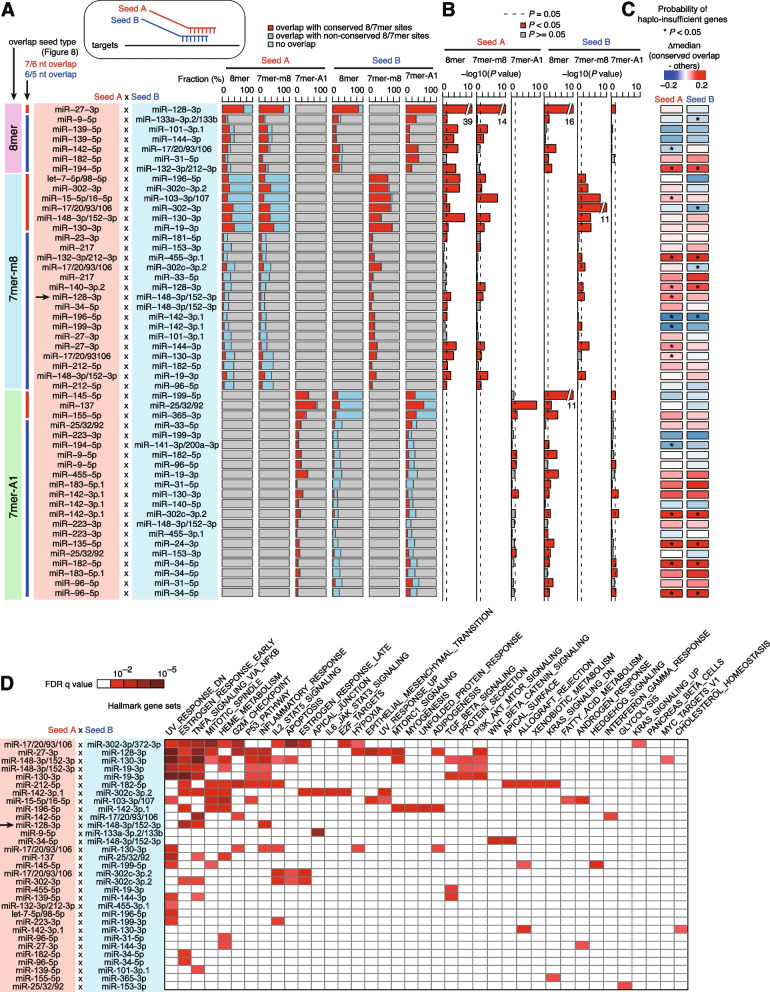
Fig. 7.
The landscape of “seed overlap” miRNA cotargeting among broadly conserved miRNAs. A Proportion of conserved target sites of each miRNA in 50 miRNA pairs with extensive seed overlap with respect to “conserved overlap,” as shown in Fig. 3A. Seed type and degree of overlap, shown on the left, correspond to Fig. 6A–C. A horizontal arrow indicates a pair of miR-128 and miR-148a. B Results of one-tailed Wilcoxon rank sum test of the conservation of target sites with “conserved overlap” relative to other target sites. Analyses were performed as in Fig. 4A, B. C Results of the one-tailed Wilcoxon rank sum test of the skewed probability of haplo-insufficient genes between “conserved overlap” targets and other targets. Analyses were performed as in Fig. 3E. D Gene set enrichment analysis of “conserved overlap” target genes performed using the hallmark gene sets in the MSigDB database. The results of the clustering analysis are shown. A horizontal arrow indicates a pair of miR-128 and miR-148a. P values were calculated using a hypergeometric test

