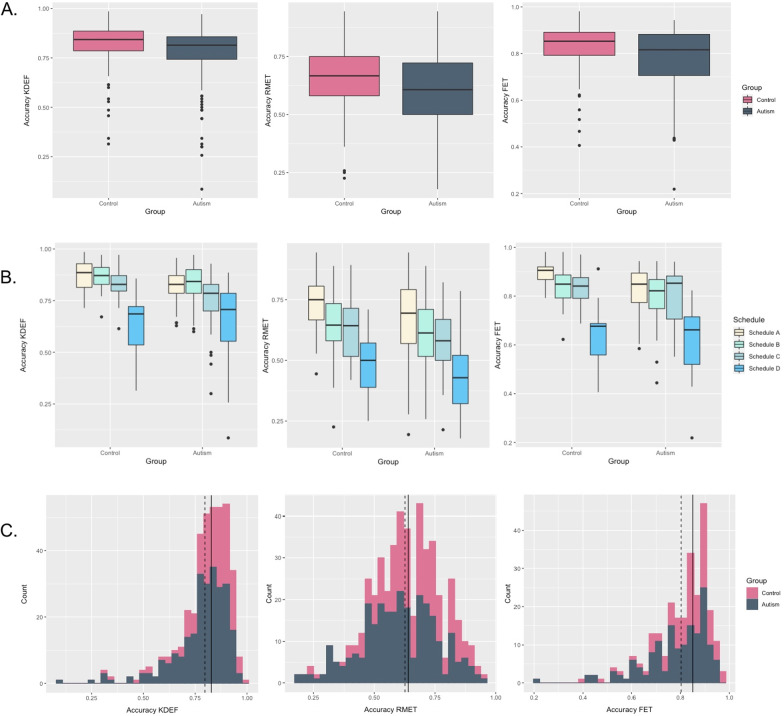
Fig. 2.
A Boxplots showing % accuracy on each task, by diagnostic group [autism, control group. The control group comprises individuals with typical development (TD) and intellectual disability]. B Boxplots showing % accuracy on each task, by diagnostic group and age group. Beige = Schedule A, adults, turquoise = Schedule B, adolescents, light blue = Schedule C, children, and dark blue = Schedule D, individuals with ID. C. Histograms, showing distributions per group. Solid line indicates 1SD below the control group’s overall median; dotted line indicates 2SDs below the median

