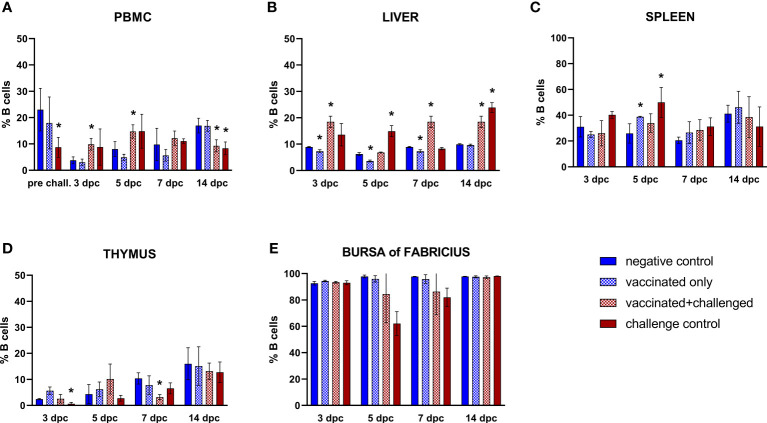
Figure 3.
Relative number of B cells within total CD45+ cells measured via FCM for each experimental group throughout the study in PBMC (A), liver (B), spleen (C), thymus (D), and bursa of Fabricius (E). Data for the two vaccinated groups (vaccinated only and vaccinated+challenged) are merged to determine values in PBMCs pre-challenge. Asterisks represent significant difference compared to the negative control at each time point (p ≤ 0.05).

