
Figure 7.
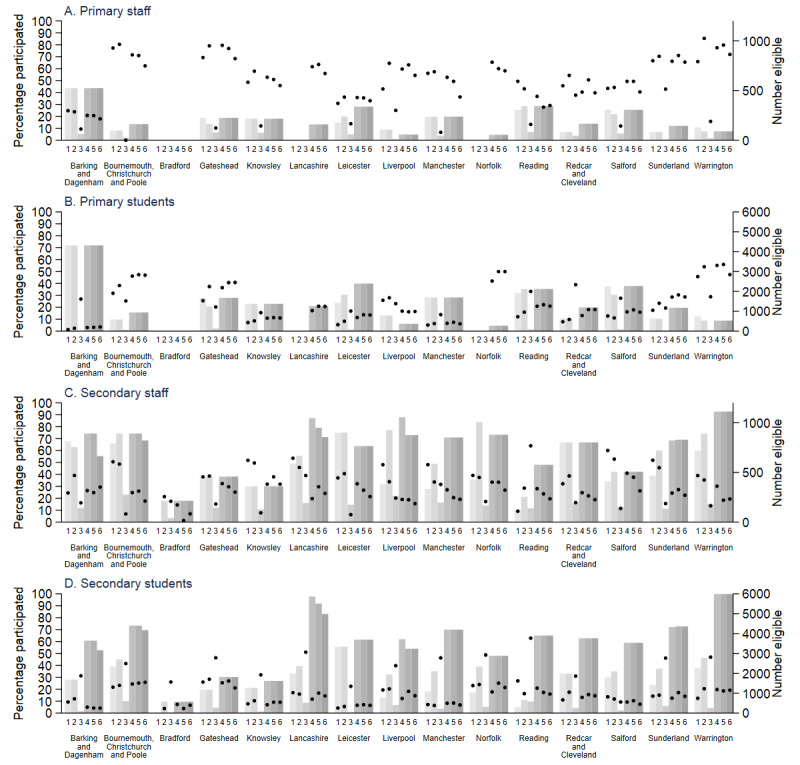
Local authority–level participation rate (percentage individuals participating of those eligible) during rounds 1 to 6 (black circles) for (A) primary school staff, (B) primary school students, (C) secondary school staff, and (D) secondary school students. Also shown are number of individuals eligible at rounds 1 to 6 (gray bars) and eligible individuals estimated from the total staff and student census in participating primary schools and the census of all staff and students in the 2 selected year groups (rounds 1 to 3) and expanded year groups (rounds 4 to 6) in participating secondary schools. Participating individuals are those who were present on the day the research team visited the school and who had at least one sample taken.