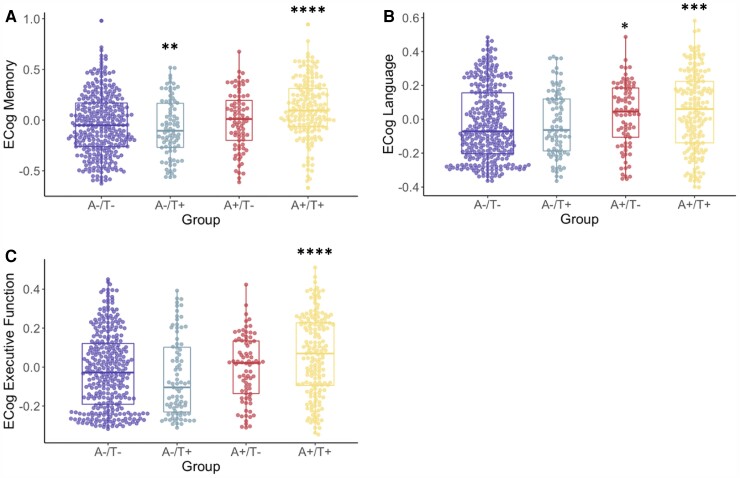
Figure 3.
A/T group differences in ECog questionnaire scores. ECog scores (A, memory; B, language; C, executive function) across A/T groups. Transformed and residualized data are depicted. ANCOVAs indicated a significant difference between groups on all measures: Memory [F(3,646) = 14.0, P < 0.001], language [F(3,642) = 6.1, P < 0.001] and executive function [F(3,634) = 8.8, P < 0.001]. *Significantly different from the A−/T− group. **Significantly different from the A−/T+ group. ***Significantly different from the A−/T− and A−/T+ groups. ****Significantly different from all other groups.

