Figure 5.
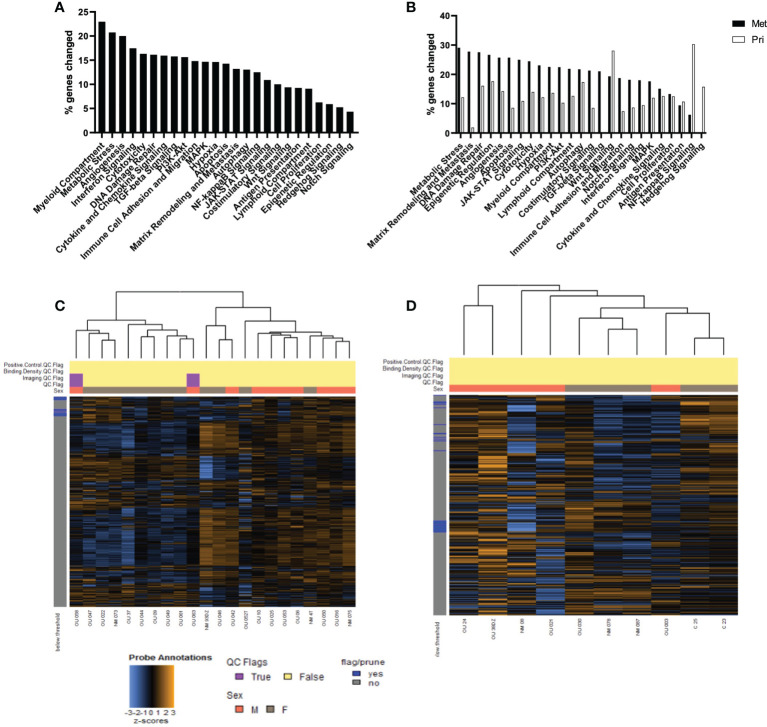
Gene expression differs in the TME of men and women in both primary and metastatic tumors. (A) The top percent of genes in pathways designated in annotated groups, as defined by NanoString technologies, which were significantly different in expression between women as compared to men (p<0.05). (B) Top percent of genes in pathways differentially expressed between men and women from primary tumor compared to metastatic tumor (p<0.05). Heatmap for NanoString analysis of primary (C) and metastatic (D) CRC samples. Gene expression levels are illustrated with a Z score. Orange indicates high expression; blue indicates low expression.

