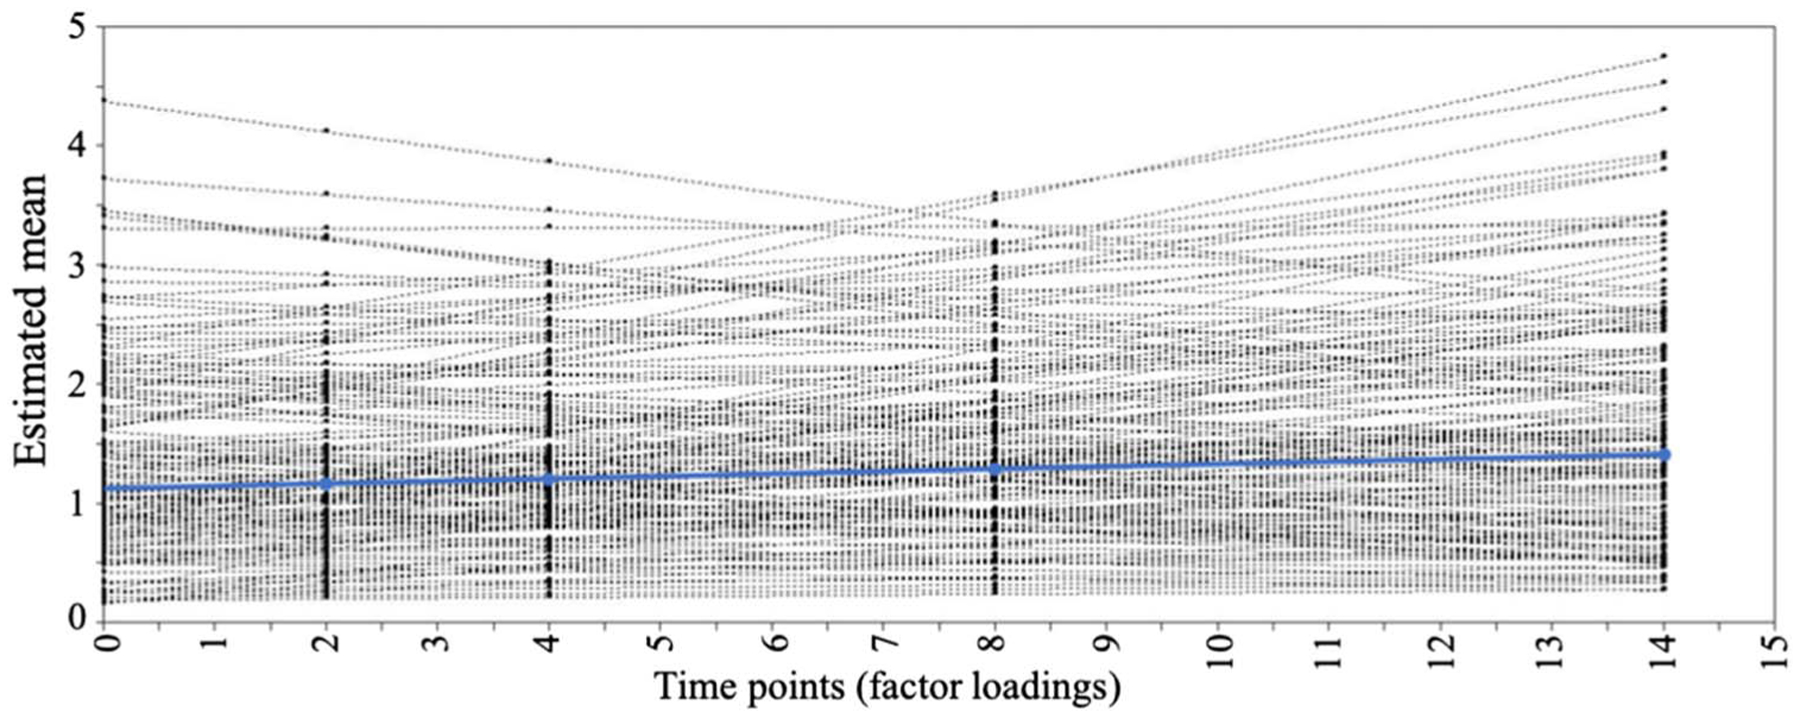
Figure 4.

Growth curve trajectory illustrating that material hardship increases with age. Figure shows linear estimated paths for each individual (black lines) as well as mean estimated group-level path trajectory (blue). Material hardship at age 1 year is set as point 0, where estimated mean [SE] for starting point (i.e., intercept) = 1.01 [.077], p < .001; variance [SE] = 0.91 [0.166], p < .001, and estimated mean [SE] change over time (slope) = 0.02 [0.008], p = .009; variance [SE] = 0.01 [0.002], p = .004.
