Fig. 3.
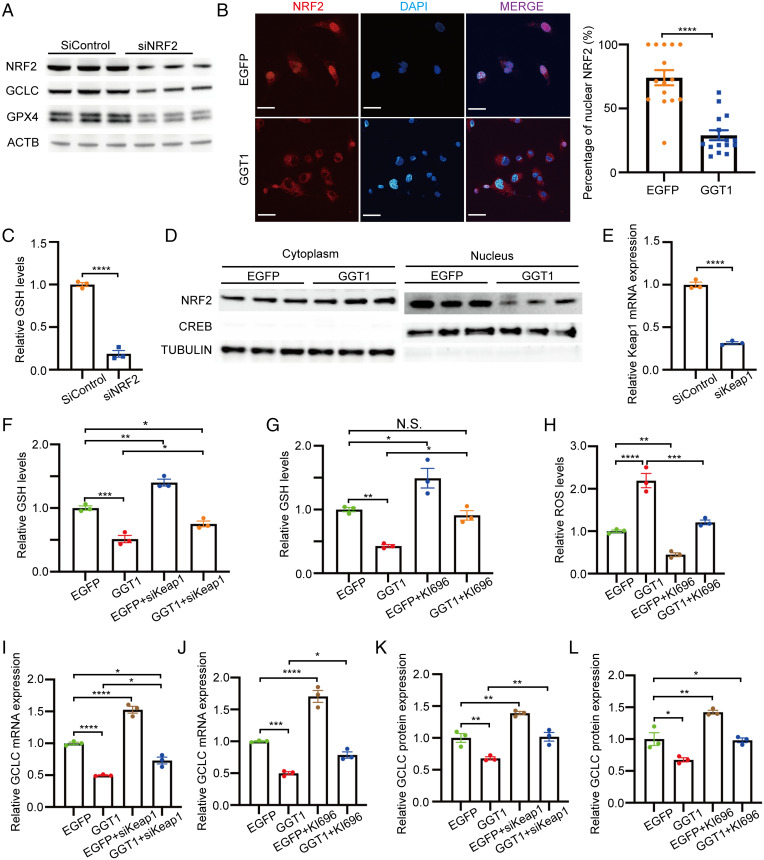
Low GGT1 promotes GSH synthesis via NRF2-mediated GCLC expression. (A) GCLC and GPX4 protein expression in UOK276 cells with siRNA knockdown of NRF2 compared with control siRNA. (B) NRF2 immunofluorescence in UOK276 cells with EGFP or GGT1 expression and quantitation of nuclear localization by Image J. Scale bars: 30 µm (620×). (C) Relative GSH abundance in UOK276 cells with siNRF2 or siControl (n = 3 biological replicates per condition). (D) NRF2 protein expression in nuclear and cytoplasmic fractions of UOK276 cells with EGFP or GGT1 expression. (E) Keap1 mRNA levels in UOK276 cells with siKeap1 or siControl (n = 3 biological replicates per condition). (F) Relative GSH abundance in UOK276 cells with GGT1 expression and siKeap1 or siControl (n = 3 biological replicates per condition). (G) Relative GSH abundance in UOK276 cells with GGT1 expression after 24-h treatment with KI696 or DMSO (n = 3 biological replicates per condition). (H) ROS levels (Deep Red assay) in UOK276 cells with EGFP or GGT1 expression after 24-h treatment with KI696 or DMSO (n = 3 biological replicates per condition). (I) GCLC mRNA levels in UOK276 cells with EGFP or GGT1 expression after 24-h treatment with KI696 or DMSO (n = 3 biological replicates per condition). (J) GCLC mRNA levels in UOK276 cells with EGFP or GGT1 expression and siKeap1 (n = 3 biological replicates per condition). (K) GCLC protein levels in UOK276 cells expressing EGFP or GGT1 after 24-h treatment with KI696 or DMSO. Densitometry was performed using Image J and GCLC/actin ratio calculated for three biological replicates per condition. (L) GCLC protein levels in UOK276 cells with EGFP or GGT1 expression and siKeap1. Densitometry was performed using Image J and GCLC/actin ratio calculated for three biological replicates per condition. Error bars represent mean ± SD. Statistical analyses were performed using two-tailed Student’s t test or one-way ANOVA if more than two groups. *P < 0.05; **P < 0.01; ***P < 0.001; ****P < 0.0001.

