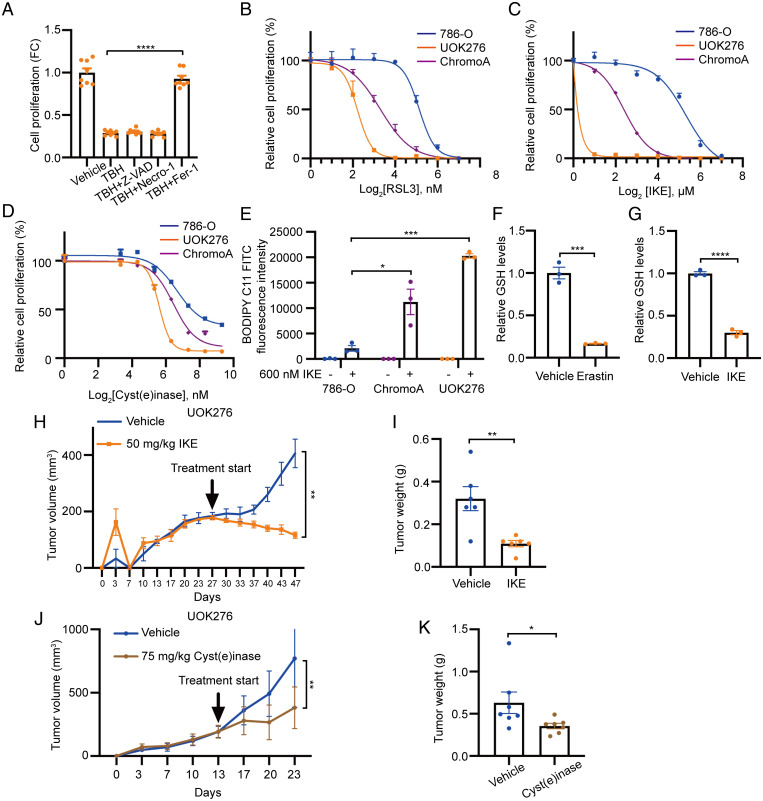
Fig. 5.
Inhibition of cysteine/cystine-xCT axis reduces GSH levels and suppresses ChRCC xenograft tumor growth. (A) Proliferation (crystal violet) of UOK276 cells with EGFP or GGT1 expression treated with TBH (15 µM) alone or in combination with Fer-1 (1 μM), Z-VAD (5 μM), or necrostatin-1 (2 μM) for 48 h (n = 8 biological replicates per condition). (B–D) Proliferation (crystal violet) of 786-0, ChromoA, and UOK276 cells following 48-h treatment with RLS3 (B), IKE (C), or cyst(e)inase (D) at multiple concentrations (n = 12 biological replicates per condition). (E) Lipid peroxidation assessed by flow cytometry for BODIPY C11 in UOK276, ChromoA, and 786-0 cells after treatment with 600 nM IKE (n = 3 biological replicates per condition). (F and G) GSH levels in UOK276 cells after 24 h of 10 μM erastin (F) or 50 nM IKE (G) (n = 3 biological replicates per condition). (H) UOK276 xenograft tumor volume after treatment with IKE (50 mg/kg/day daily intraperitoneal) or vehicle control, beginning on day 28 (n = 6 to 7 mice/group). (I) UOK276 xenograft tumor weight on day 19 of vehicle and IKE treatment (n = 6 to 7 mice/group. (J) UOK276 xenograft tumor volume after treatment with vehicle or cyst(e)inase (75 mg/kg/day) (n = 7 mice/group). (K) Tumor weight at day 10 of cyst(e)inase treatment (n = 7 mice/group). Error bars represent mean ± SD. Statistical significance was calculated using one-way ANOVA with Tukey’s multiple comparisons test. *P < 0.05; **P < 0.01; ***P < 0.001; ****P < 0.0001.

