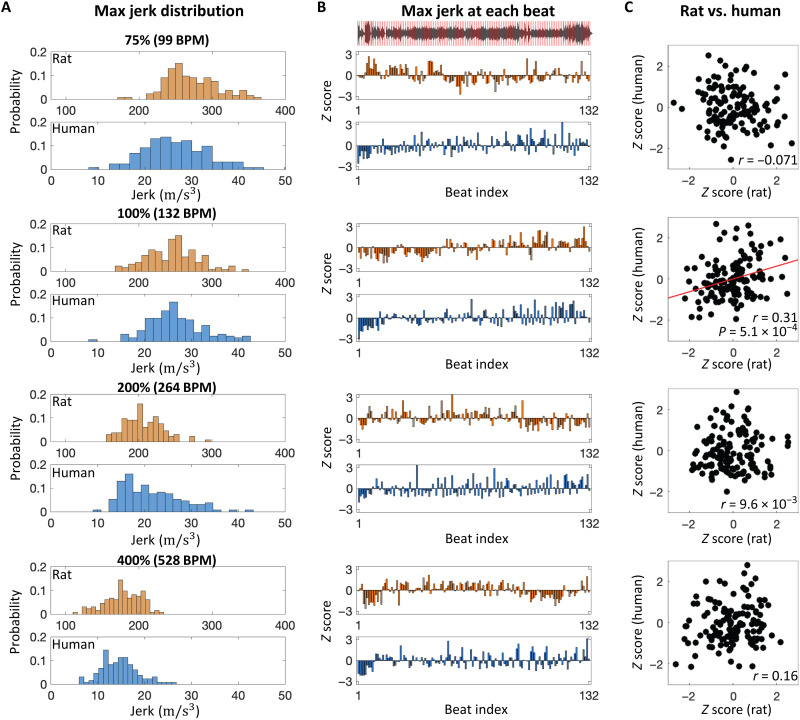
Fig. 2. Comparison of beat synchronization between rats and humans during music presentation (K.448).
(A) Distribution of maximum jerk between each putative beat as a function of playback tempos (75, 100, 200 and 400%). (B) Maximum jerk at each beat. Z scores of jerk were plotted at each beat index (1 to 132). The sound waveform of music with putative beat timings (red lines) are shown in the top inset. (C) Correlation of jerk at each beat index between rats and humans. The correlation coefficient (r) is indicated in each inset.

