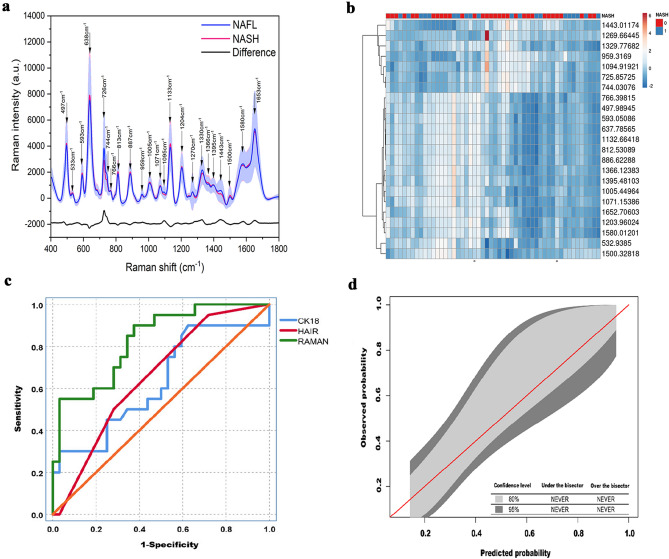
Fig. 2.
Diagnostic performance of the SERS analysis for the non-invasive diagnosis of NASH. a comparison of the mean spectrum for NAFL blood serum samples (black line) versus NASH blood serum samples (red line). b heat map of the association between NASH and selected SERS bands. c AUROC of the validation cohort, and d calibration curve of the validation cohort

