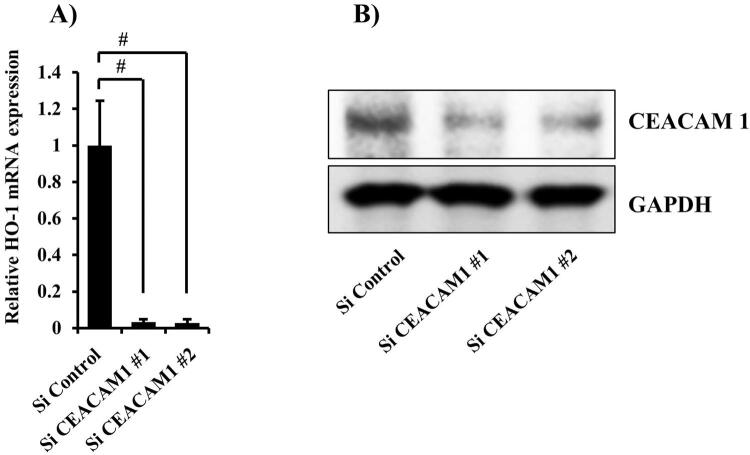
Figure 5. Knockdown of CEACAM1 expression by siRNA.
(A) Cells were transfected with CEACAM1 siRNA for 48 hours. Gene mRNA levels are presented relative to that of β-actin. Values are shown as fold increase as compared with non-treated cells and presented as the mean±SD of three independent experiments. #Significantly different from Si control-transfected cells (Bonferroni/Dunn's multiple comparison test: p<0.05).
(B) Cells were transfected with CEACAM1 siRNA for 48 hours, after which cell extracts were subjected to SDS-PAGE. Western blotting analysis with antibodies against anti-CEACAM1 and GAPDH was performed. The experiments were performed at least three times, with representative results shown

