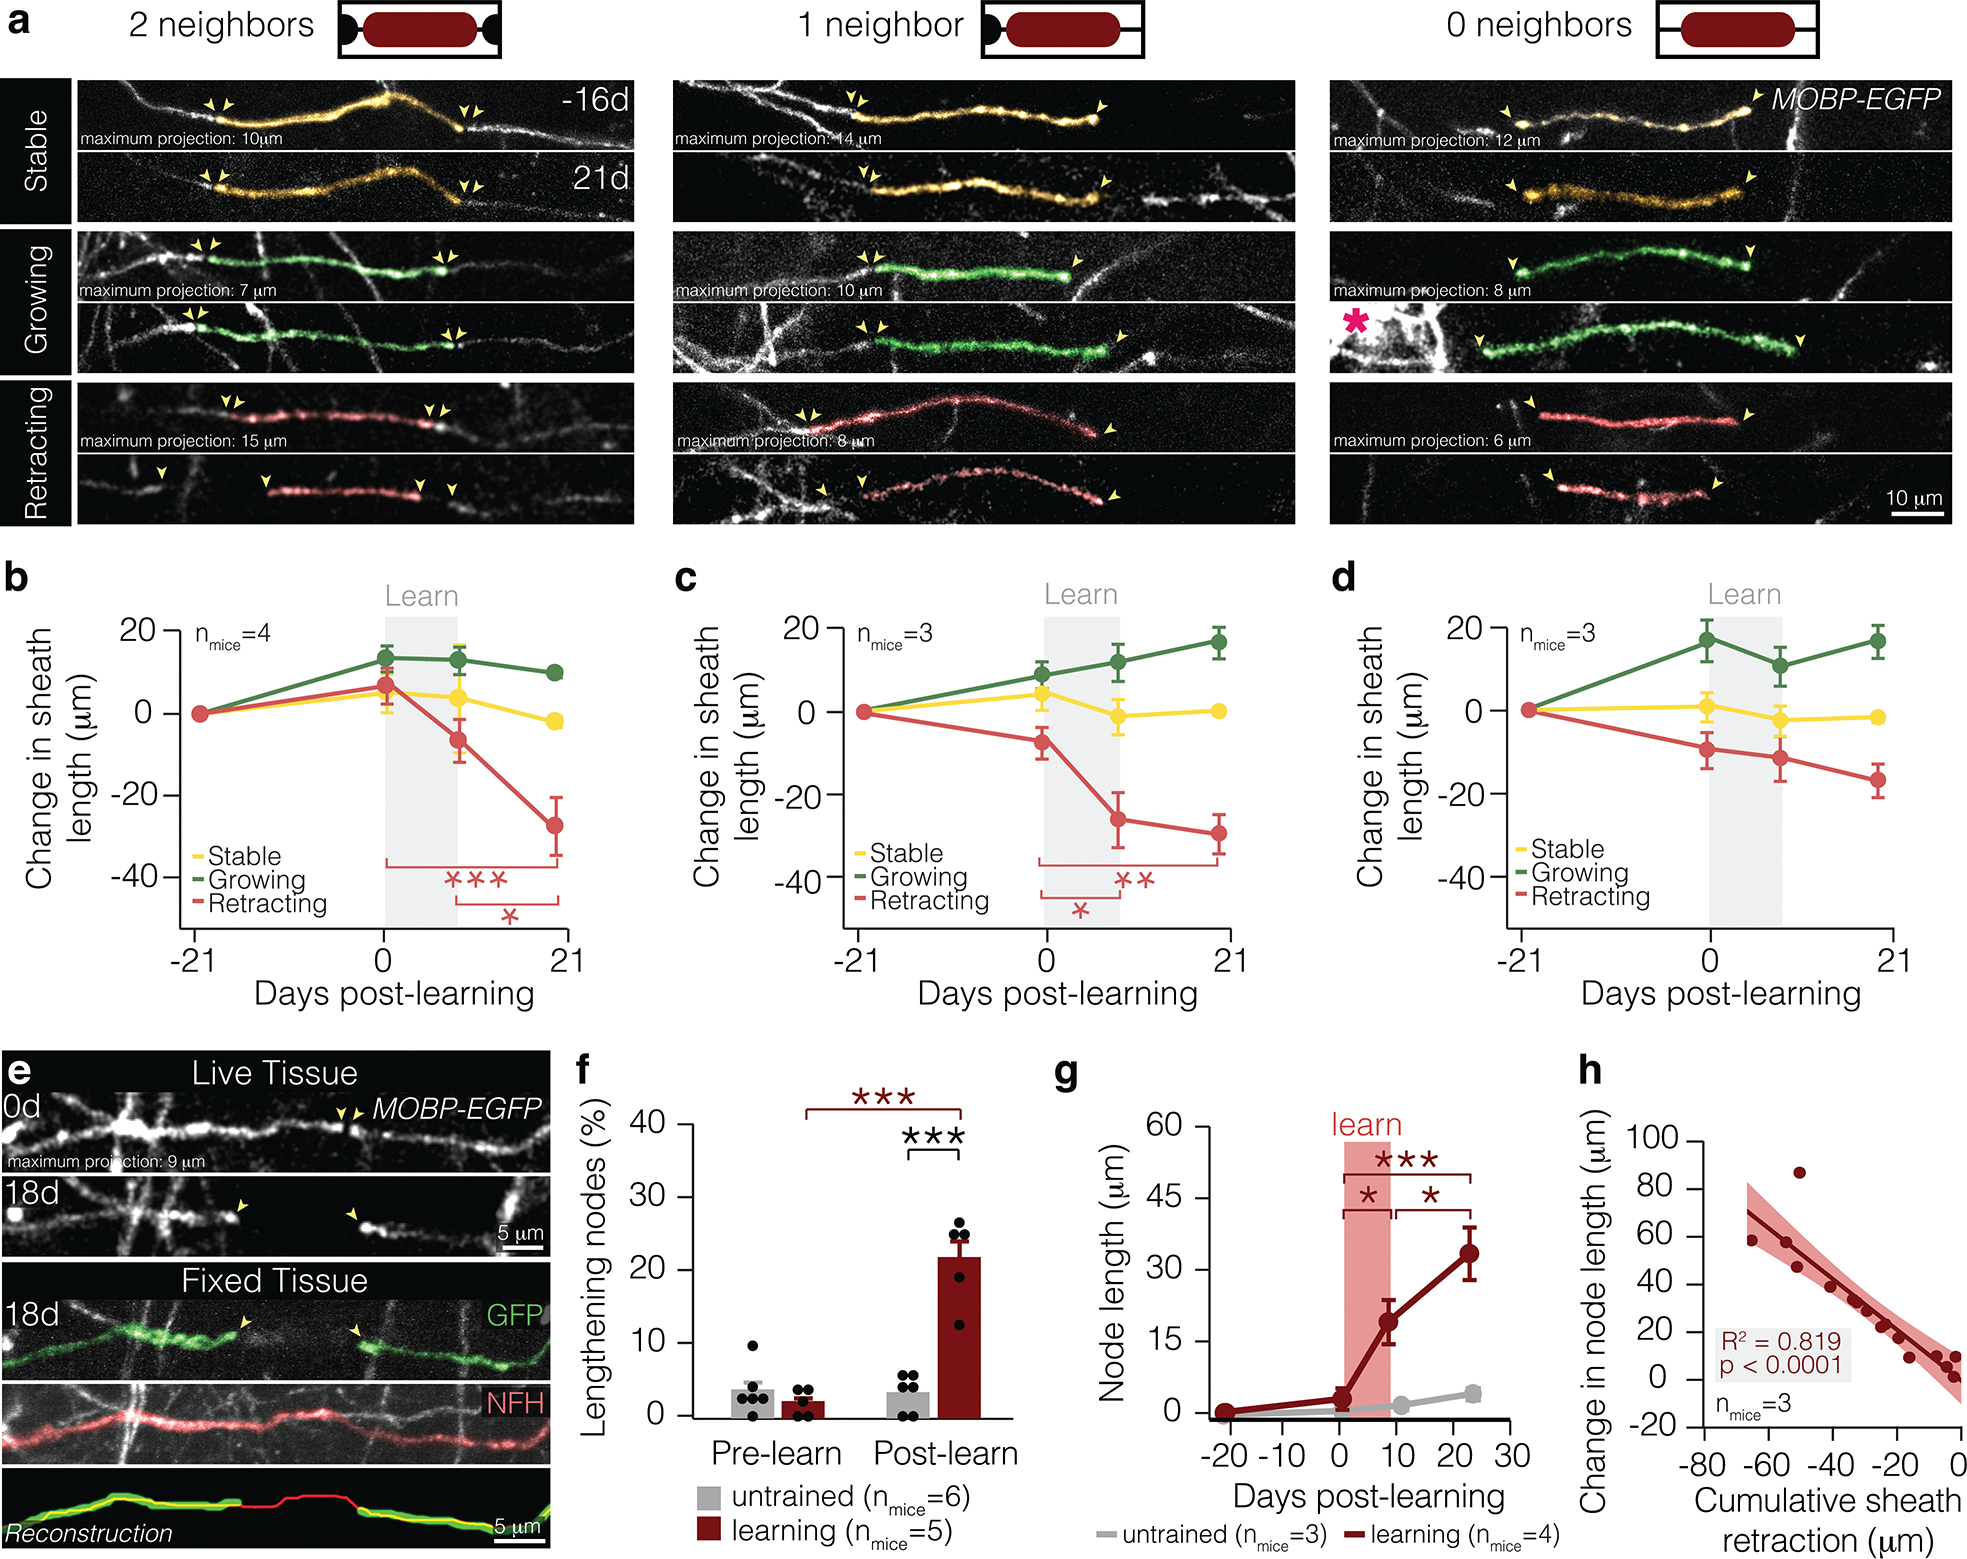
Figure 1 |. Learning-induced sheath retraction modifies node length.

a, All types of sheaths exhibit three behaviors: stable (top), growing (middle), and retracting (bottom). Note newly-generated oligodendrocyte (middle-right pink asterisk). b, Retraction of sheaths with two neighbors is specifically modulated by learning (F3,48 = 9.04, p < 0.0001) and continues for two weeks after learning (0d vs. 21d, p < 0.0001; 9d vs. 21d, p = 0.021; Tukey’s HSD). c, Retraction of sheaths with one neighbor is specifically modulated by learning (F3,40 = 9.93, p < 0.0001) and finishes within the learning period (p = 0.029; Tukey’s HSD). d, Dynamics of sheaths with 0 neighbors are not specifically modulated by learning. e, A longitudinally-imaged, lengthened node before (0d) and after learning (18d), and that same node in fixed and sectioned tissue stained for GFP (green) and neurofilament (NFH, red). The bottom panel shows a reconstruction of the lengthened node and axon. Images manually resliced for clarity. Sheaths of interest pseudo-colored. f, Learning modulates proportion of nodes lengthening (F1,9 = 38.85, p = 0.0002). More nodes lengthen in the two weeks following learning than before learning in mice that receive motor learning (p < 0.0001; Tukey’s HSD). In the two weeks following learning, more nodes lengthen in learning mice than in untrained mice (p < 0.0001; Tukey’s HSD). g, Learning modulates node length (F3,83.38=4.88, p=0.0036). Nodes increase significantly in length during learning (p = 0.039; Tukey’s HSD) and continue to lengthen following learning (p = 0.03; Tukey’s HSD). h, Changes in node length are significantly correlated to changes in sheath length of associated myelin sheaths (Standard least squares regression, p < 0.0001; shading represents 95% confidence interval). *p < 0.05, **p < 0.01, ***p < 0.0001, NS, not significant; bars and error bars represent mean ± s.e.m. For detailed statistics, see Supplementary Table 3, Figure 1.
