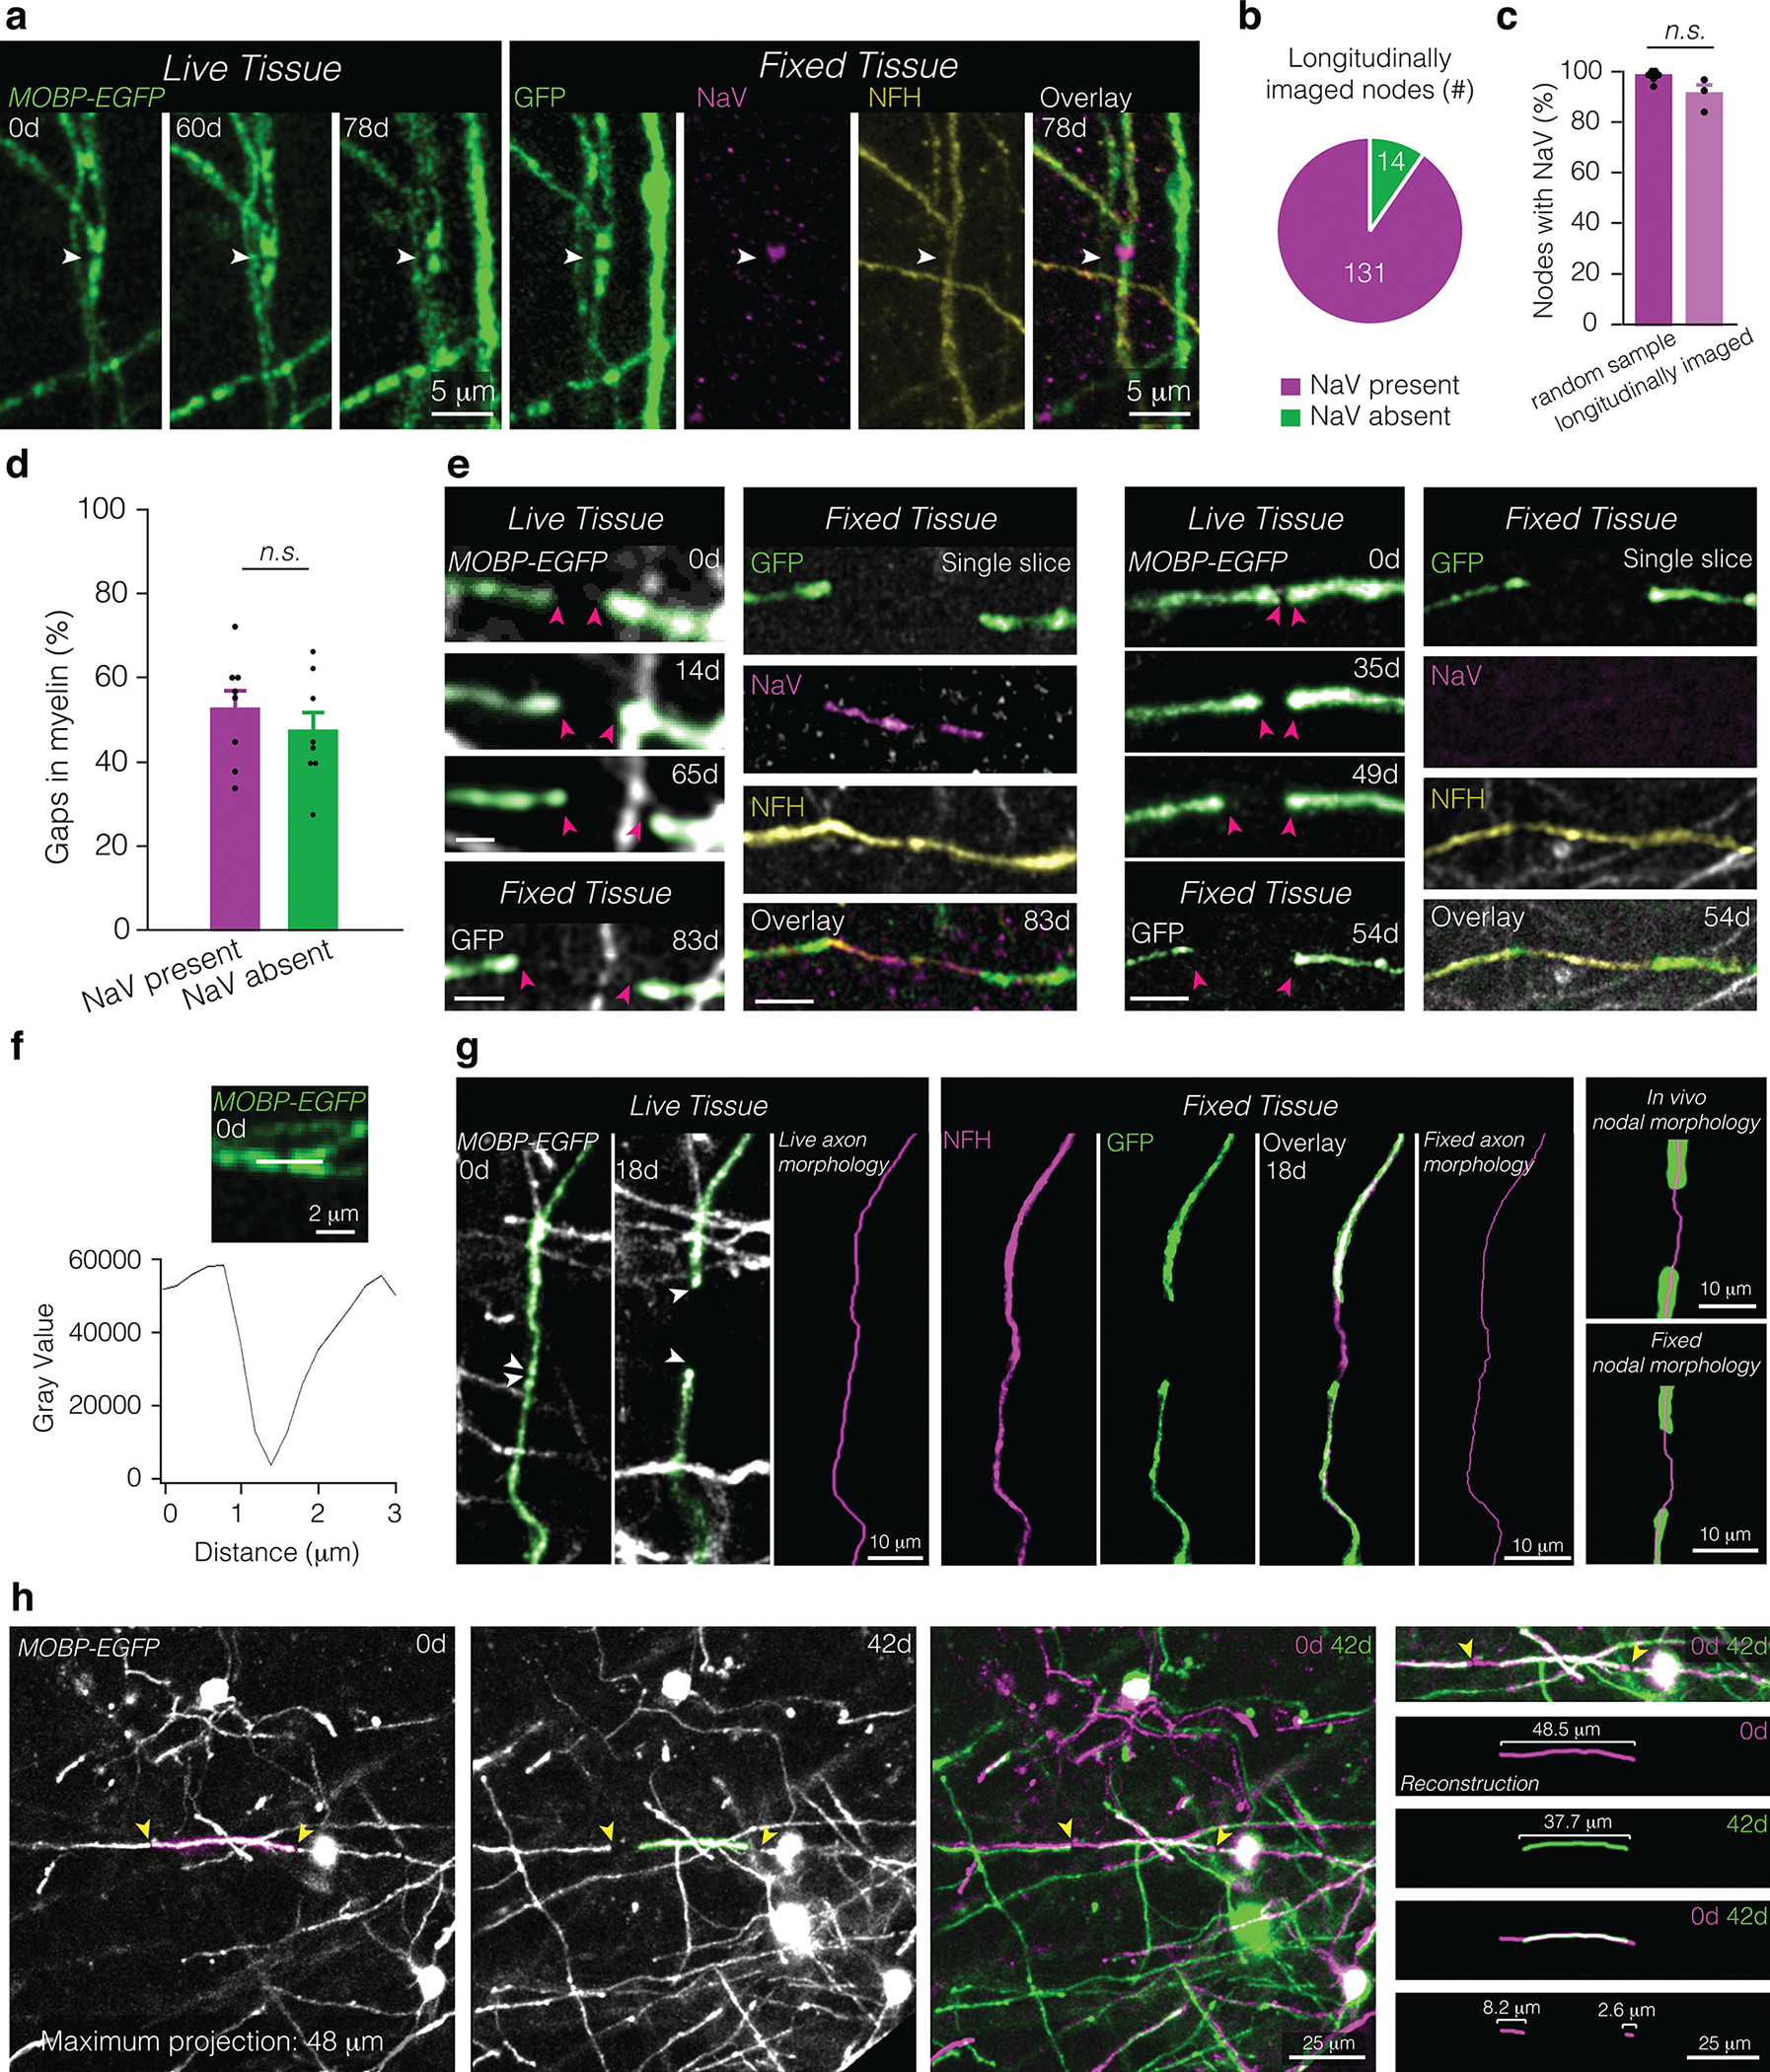
Extended Data Fig. 3. Identifying and tracing nodes and axons across live and fixed tissue.

a, The same node in live imaged (“Live Tissue”, left) and fixed, sectioned tissue (“Fixed Tissue”, right) stained for oligodendrocytes and myelin (GFP, green), sodium channels (NaV, magenta), and axons (NFH, yellow). White arrow points to node across time and in fixed tissue. b,c, 90.90±3.73% of nodes visualized in vivo possess NaV staining characteristic of nodes of Ranvier (b), comparable to values of nodes identified fixed tissue of age-matched controls (c; random sample, nmice = 6; longitudinally imaged, nmice = 3). d, No difference in the proportion of gaps in myelination (larger than 3 microns) with and without appreciable sodium channel distributions in fixed tissue of age-matched controls (nmice = 8; Paired Student’s t-test). e, Representative in vivo imaging and post-hoc immunostaining of a lengthening node with sodium channels (left) and without appreciable sodium channels (right). f, The same node confirmed with NaV staining in (a) is identified in live imaging by a marked decrease in autofluorescence between two GFP-labeled myelin paranodes. g, Axon morphology is accurately identified in vivo as confirmed by post-hoc immunostaining of the same tissue. A lengthening node in vivo (“Live Tissue”, left) and fixed, sectioned tissue (“Fixed Tissue”, middle). Axon trajectory is identified using the shape of the myelin sheath prior to node lengthening (“Live axon morphology”, magenta) and confirmed using post-hoc immunostaining of the same sheaths for axons (NFH, magenta) and myelin (GFP, green) and reconstructions of the axons (“Fixed axon morphology”, magenta). In vivo node morphology (“In vivo nodal morphology”, top right) is reconstructed and confirmed using post-hoc immunostaining and morphological reconstruction (“Fixed nodal morphology”, bottom right). h, Sheath length and change in sheath length is determined by aligning fields of view using fiduciary marks (e.g. cell soma) which extend across the entire duration of the study, including pre-existing oligodendrocytes, which maintain their position throughout the course of imaging (left). Change in sheath length is mirrored by a change in paranode position (right). To determine the change in sheath length, the distance between the initial and final paranodal position is traced using Simple Neurite Tracer and overlayed stacks. Bars and error bars represent mean ± s.e.m unless otherwise noted. For detailed statistics, see Supplementary Table 3.
