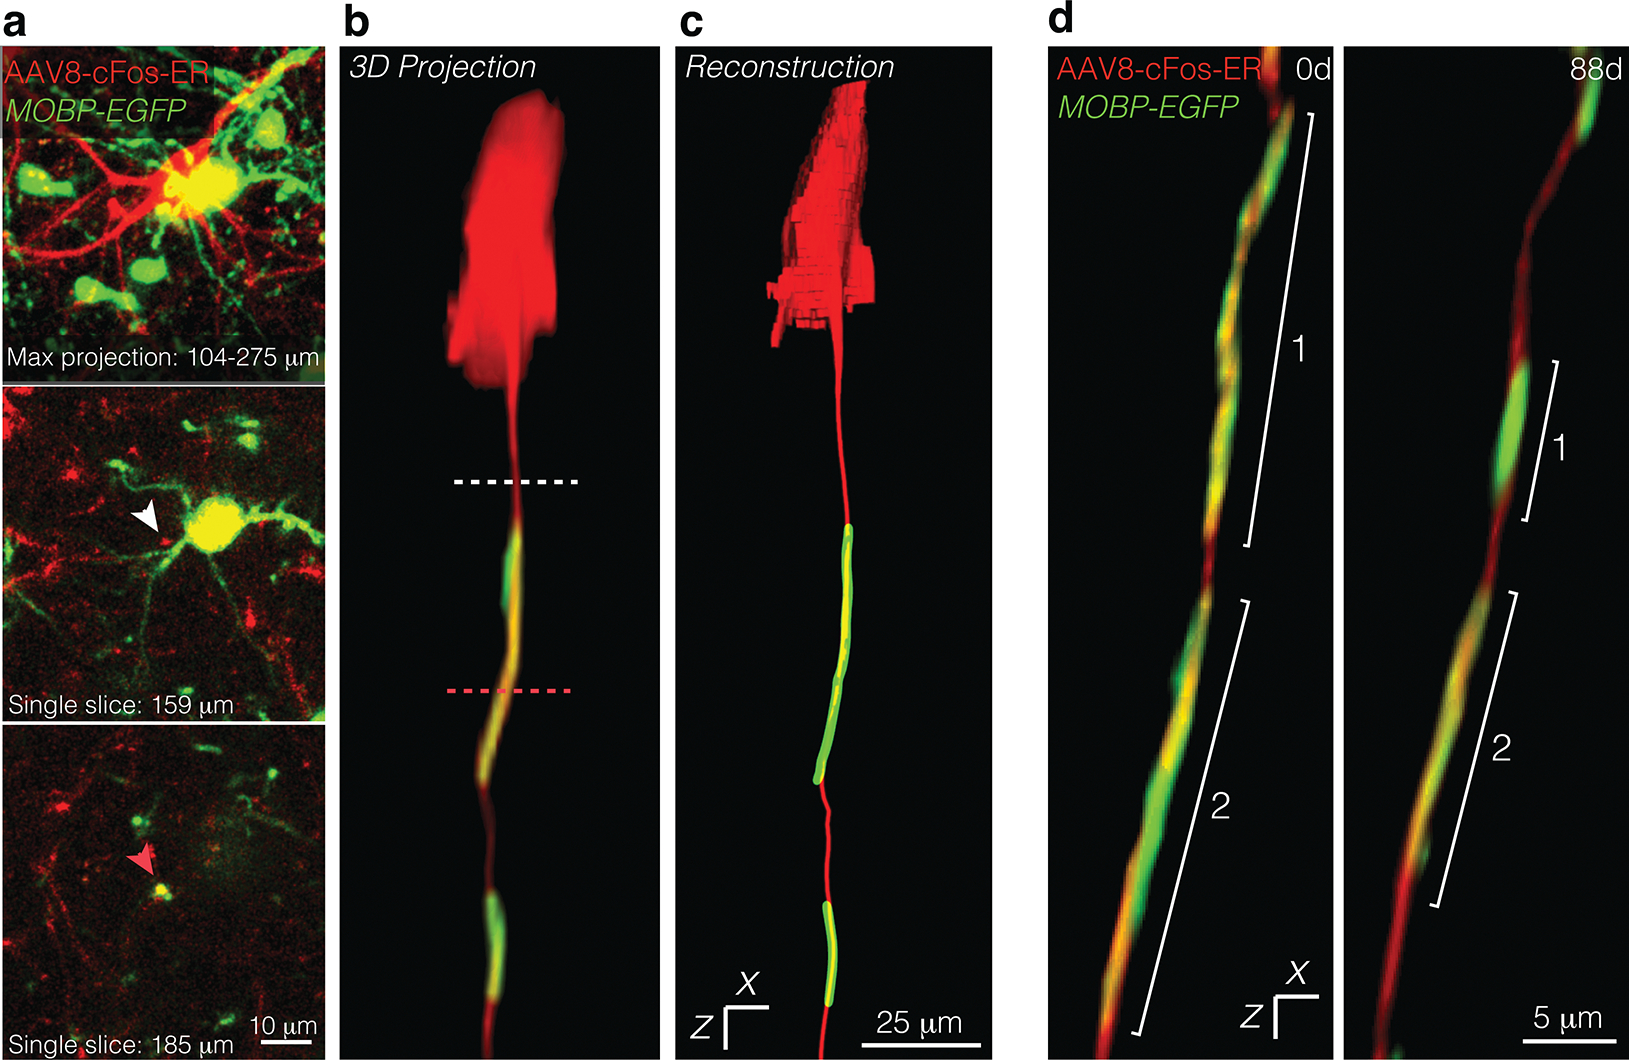
Extended Data Fig. 5. Tracking virally labeled axons across time in vivo.

a, Maximum projection of a cFos+ neuron (AAv8-cFos-ER, red) and surrounding oligodendrocytes and myelin (in vivo, green) (top). Single slice at 159 microns below the pial surface, with white arrow identifying unmyelinated region of a cFos+ axon (middle). Single slice at 185 microns below the pial surface, with pink arrow identifying a myelinated region of a cFos+ axon (bottom). b, 3D projection of the cFos+ neuron and associated myelin sheaths from (a), with dashed lines corresponding to the single slices in (a). c, The same neuron as in (a), reconstructed using Simple Neurite Tracer. d, 3D projection of a longitudinally imaged axon at the outset of the imaging experiment (0d) and at the final imaging timepoint (88d).
