
Extended Data Fig. 6. Biological correlates of computational modeling data.
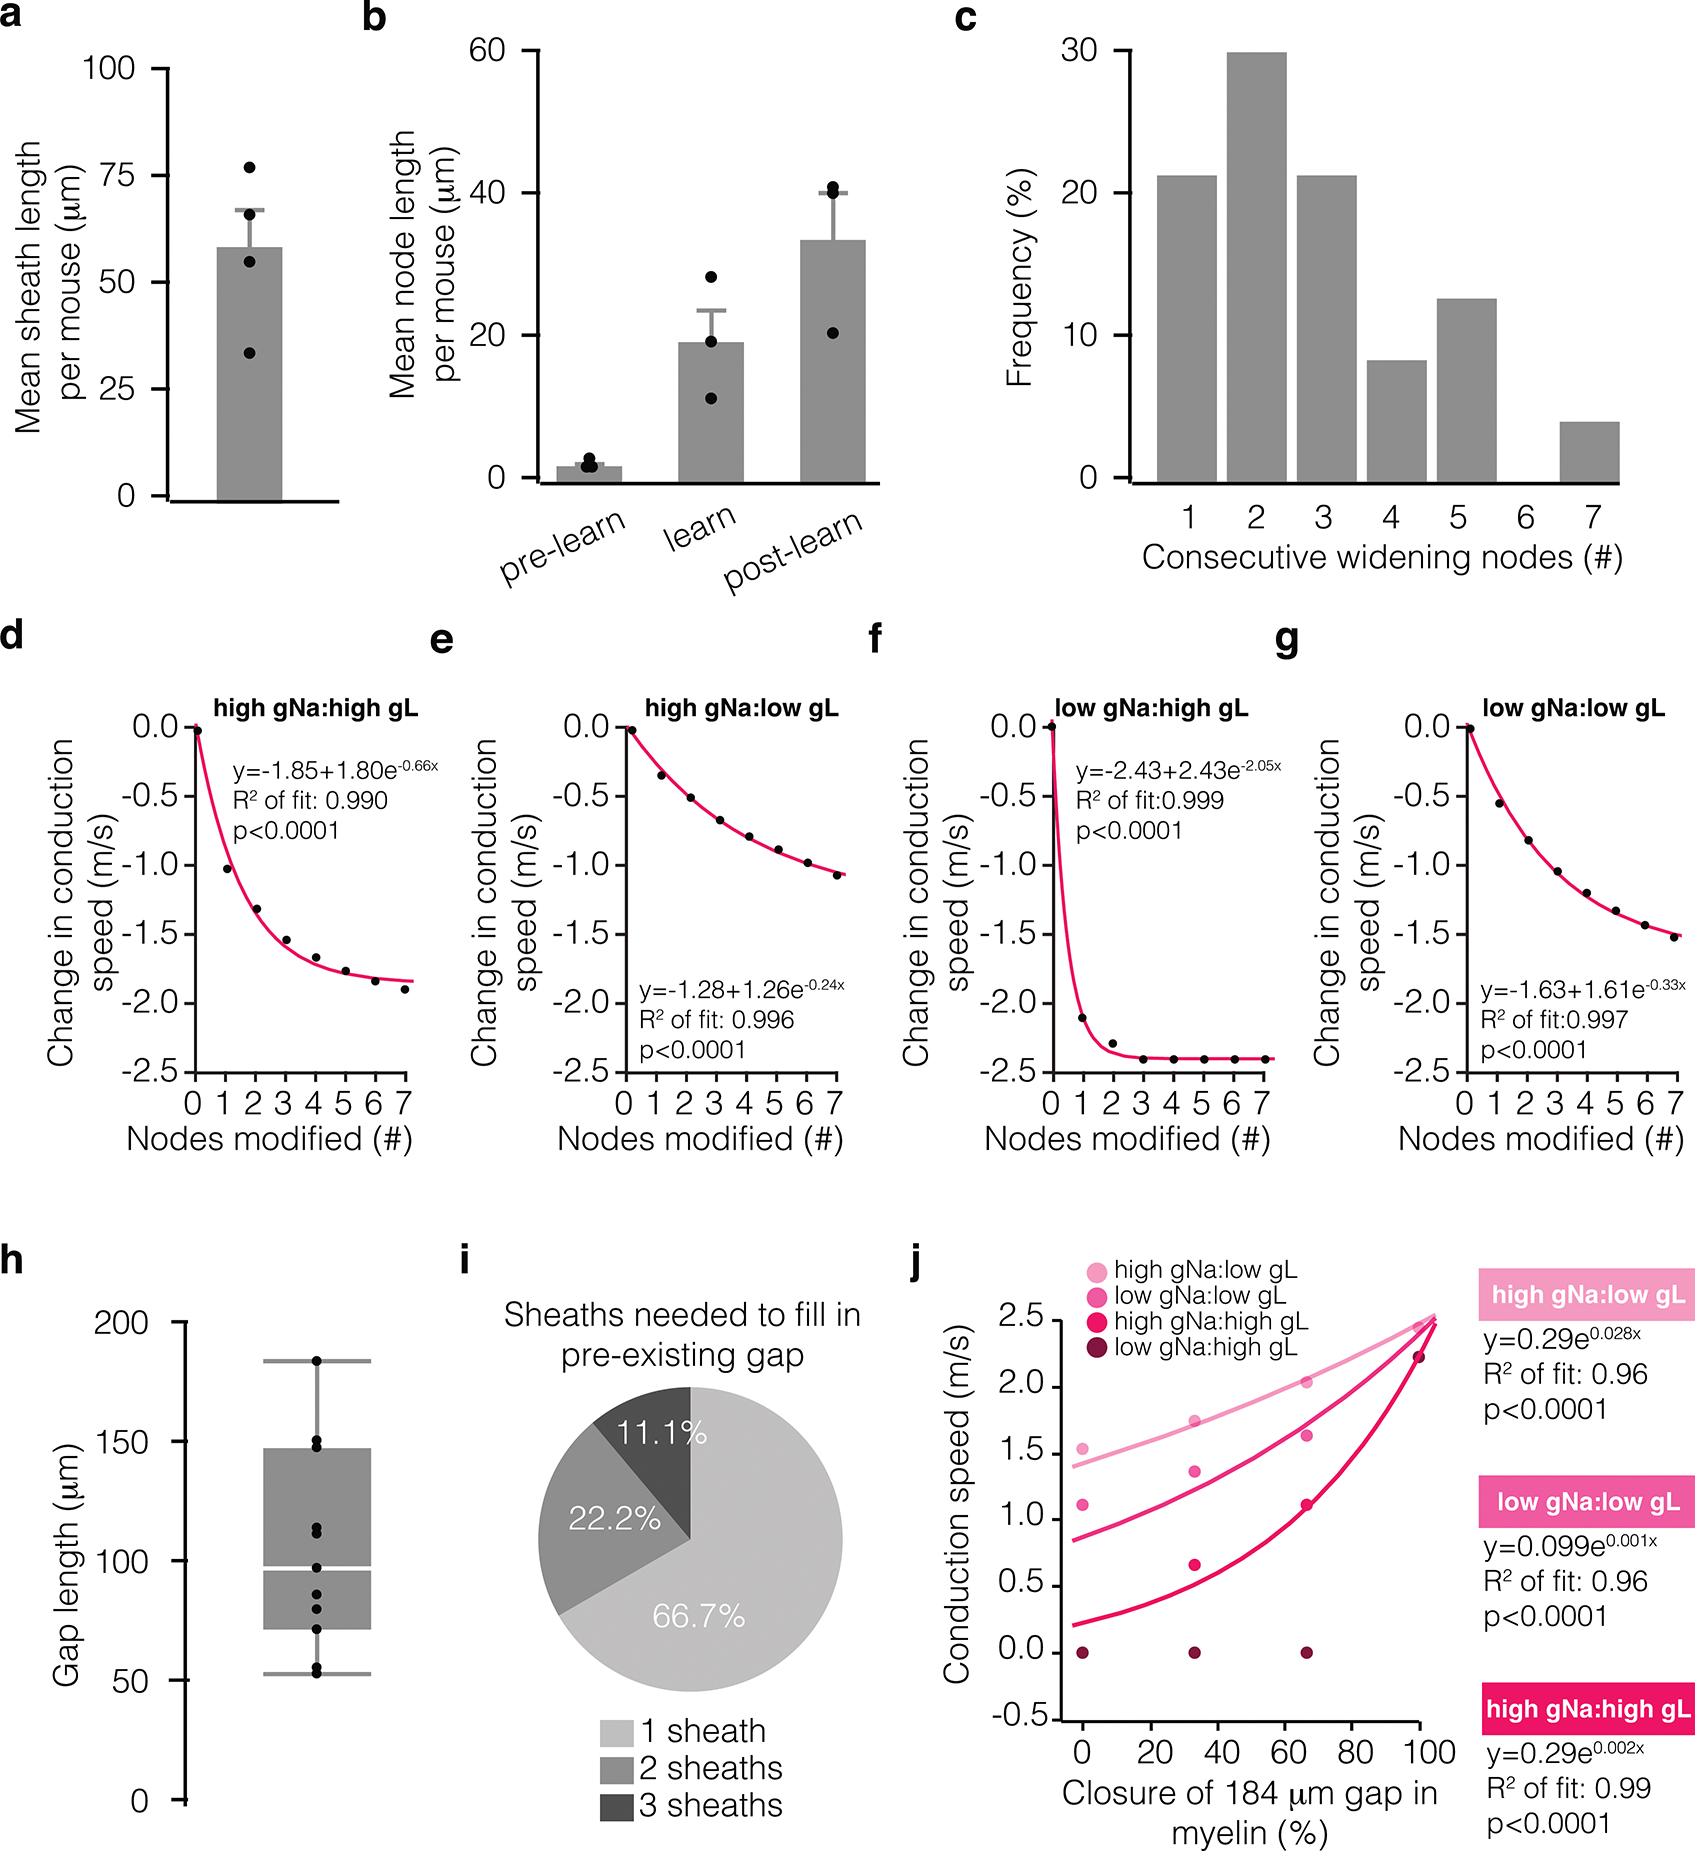
a, Average pre-existing myelin sheath length per mouse (nmice = 4). b, Mean node length of lengthening nodes per mouse, measured across time in pre-learning, learning, and post-learning stages (nmice = 3). c, Distribution of the number of consecutive lengthening nodes along a single axon. d-g, Modeled change in conduction speed as a function of the number of consecutively remodeled nodes at different sodium:leak conductance ratios (node with = 35 microns, pink exponential fit; Chi-square goodness of fit test). Conductance ratios were generated using either 0.4 S/cm2 (low) or 3.4 S/cm2 (high) for sodium conductance (gNa) and either 0.01 S/cm2 (low) or 0.08S/cm2 (high) for leak conductance (gL). h, Length of unmyelinated axon in that received new sheath addition following learning, measured from one sheath to the nearest neighboring sheath (nmice = 6; box plot, white bar = median, bounds of rectangle are Q1 and Q3; whiskers reflect minima and maxima). i, Proportion of gaps filled by 1, 2, or 3 sheaths following learning. j, Modeled change in conduction speed as a function of proportion of a 184 micron gap filled in by new myelin (pink exponential fit; Chi-square goodness of fit test). Conductance ratios as in d-g. Bars and error bars represent mean ± s.e.m unless otherwise noted.