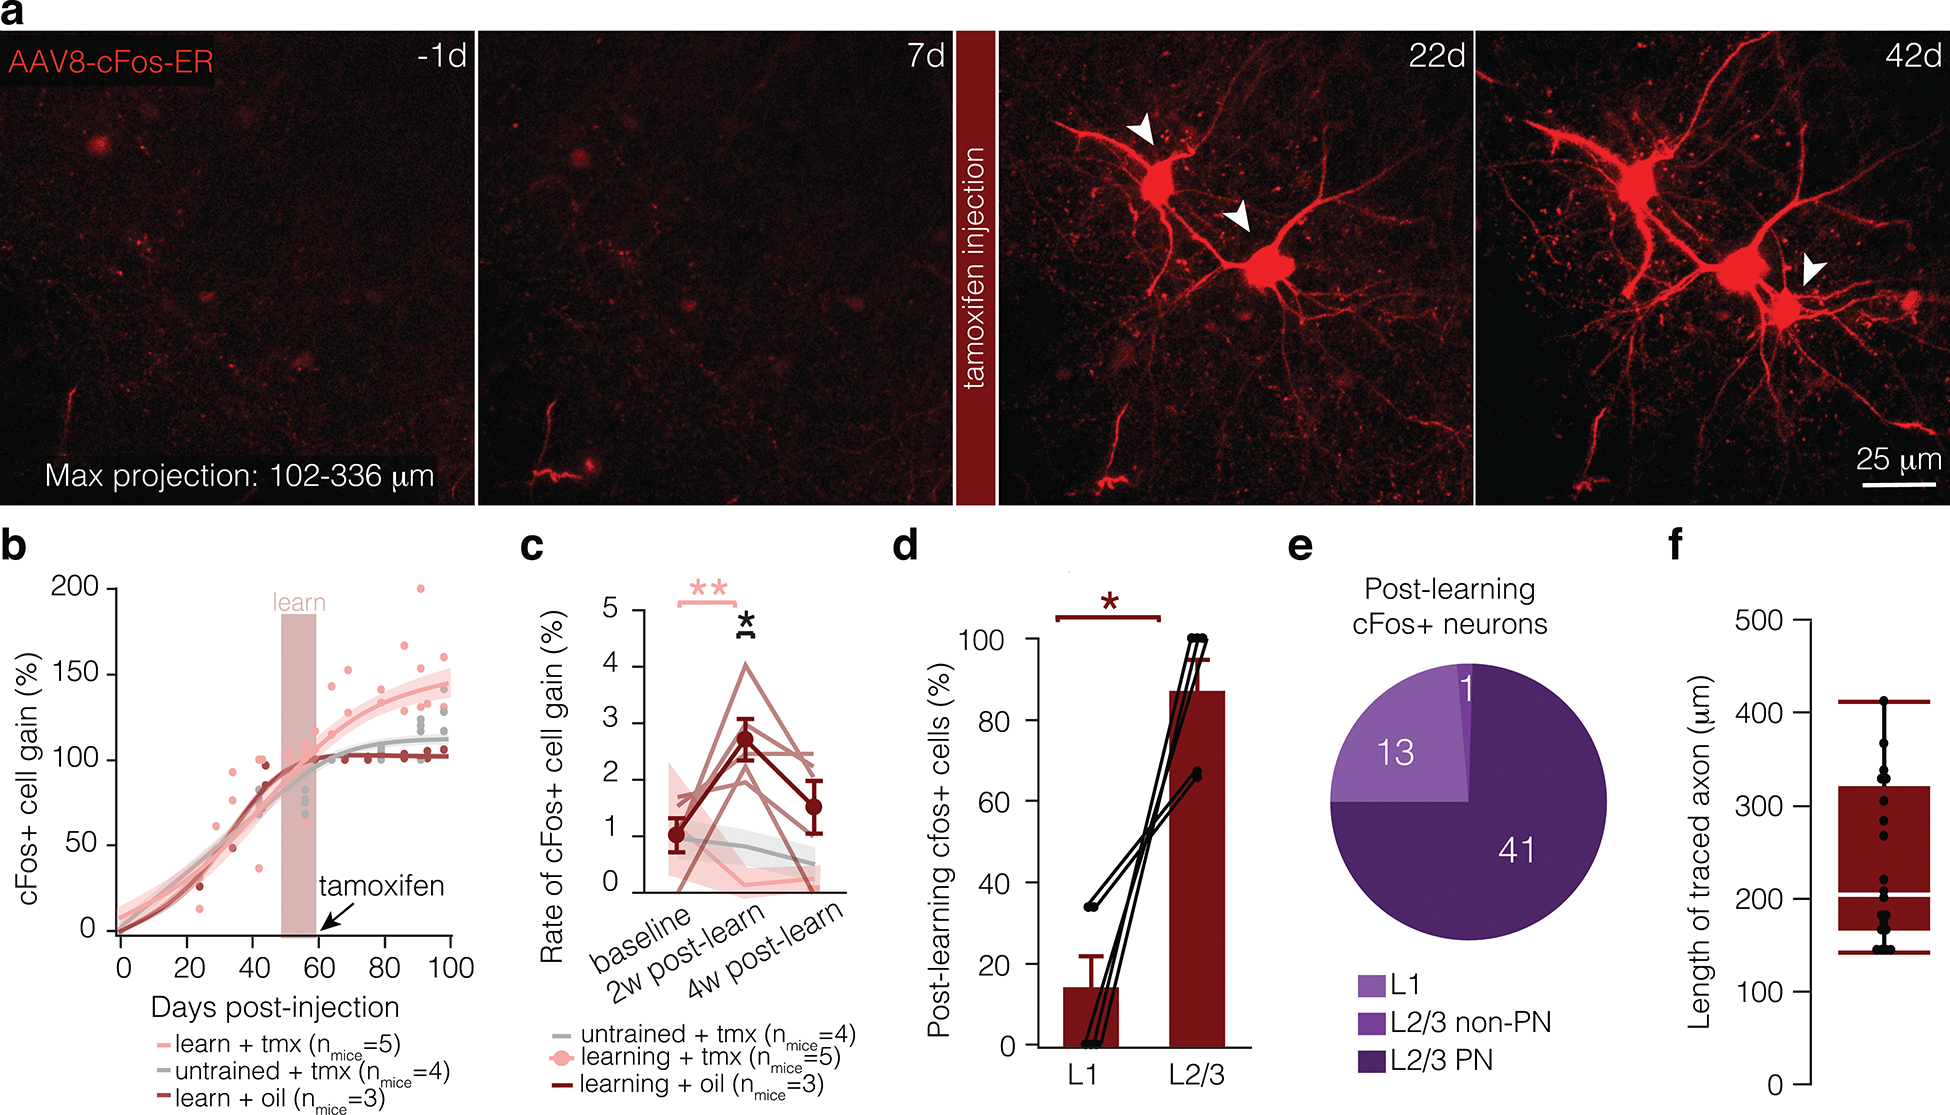
Extended Data Fig. 7. Characterizing AAv8-cFos-ER virus.

a, Maximum projection of motor cortex injected with the cFos virus 1 day before learning (−1d), one week after learning (7d), three weeks after learning (22d), and 5 weeks after learning (42d). Tamoxifen was injected 3 hours after the final day of learning (7d). b, Fit curve for modeled change in cFos+ cell gain (calculated as % of tamoxifen-independent cFos+ neurons, i.e. the number of neurons labeled at 60 days) in mice that learn and receive tamoxifen (pink), untrained mice (grey), and mice that learn and are injected with sunflower oil (red). Each dot represents proportion of labeled neurons per mouse at a given timepoint. Shading represents 95% confidence interval. c, Rate of cFos+ cell gain in mice that learn and receive tamoxifen (pink), untrained mice (grey), and mice that learn and are injected with sunflower oil (red). Mice that learn have a heightened rate of cFos+ cell gain in the two weeks following learning, while the percentage of cFos+ neurons did not change in untrained mice and oil injected mice over the course of the experiment. Lines and shading represent mean ± s.e.m. d, Significantly more cFos+ cells appear in L2/3 relative to L1 following learning and injection of tamoxifen. e, The majority of learning-activated cells are putative L2/3 pyramidal neurons (determined by morphology). f, Distribution of traced axon lengths for cFos+ neurons (nmice = 5; box plot, white bar = median, bounds of rectangle are Q1 and Q3; whiskers reflect minima and maxima). Bars and error bars represent mean ± s.e.m unless otherwise noted. For detailed statistics, see Supplementary Table 3.
