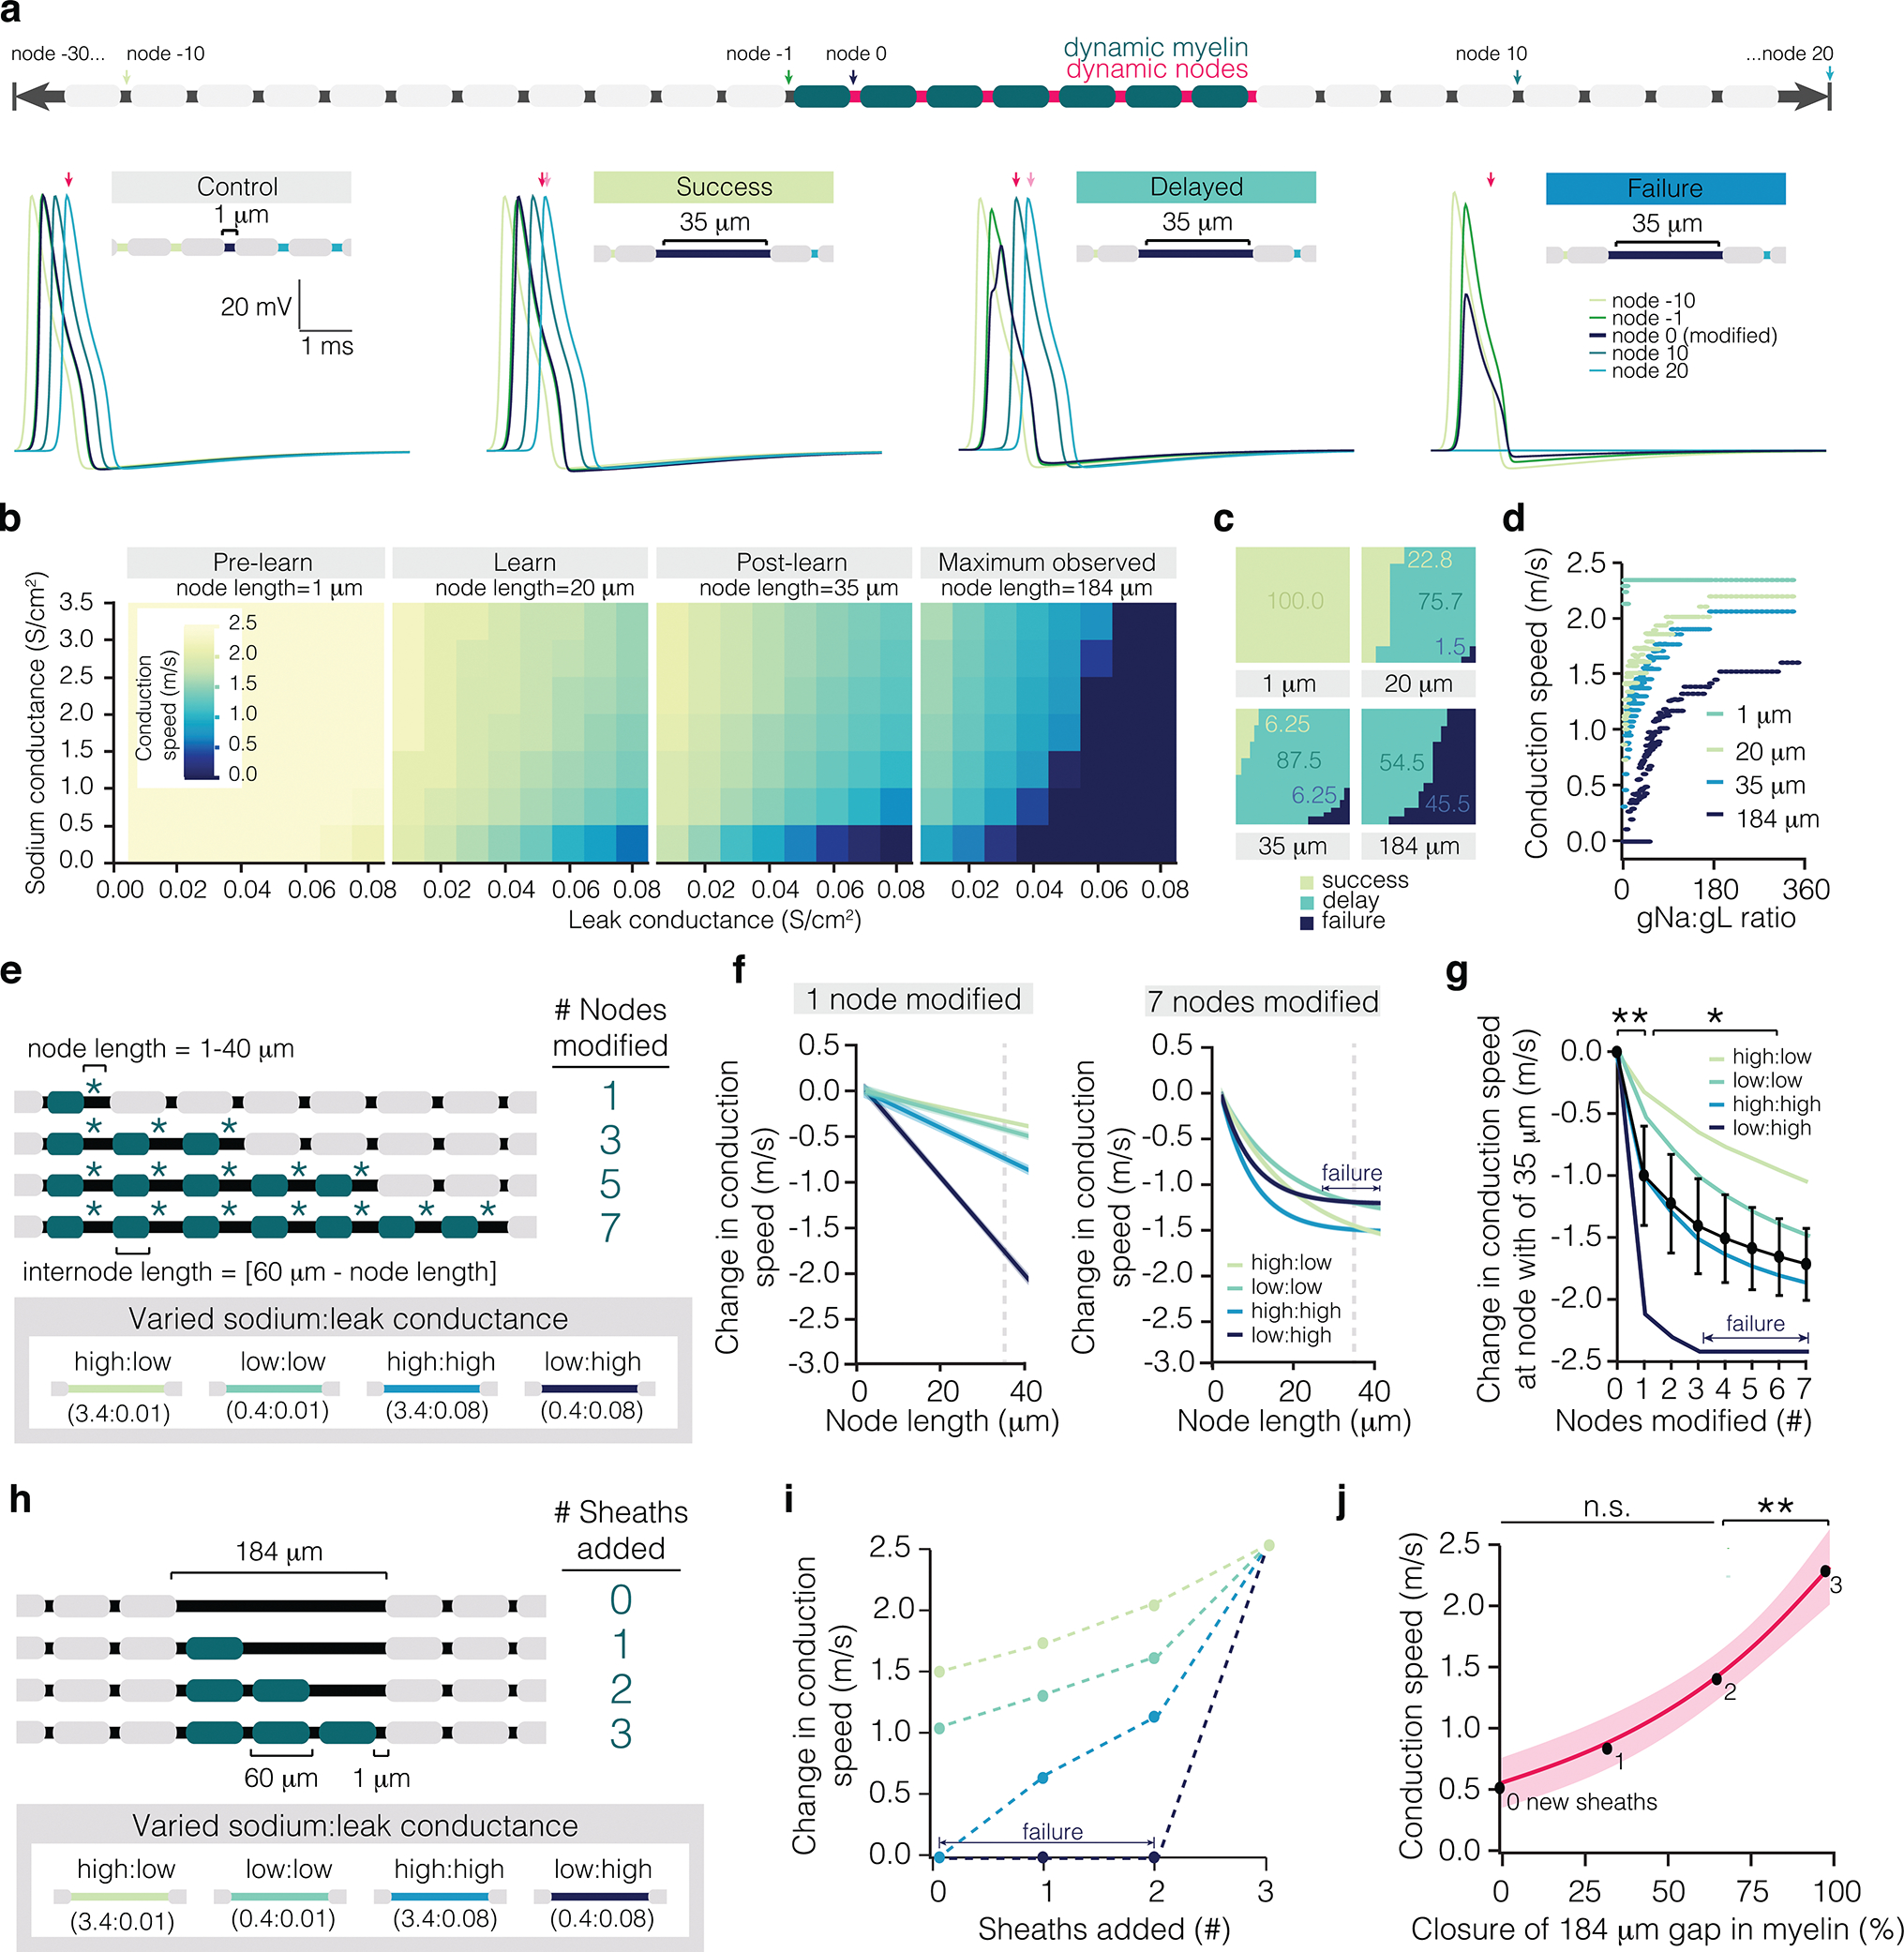
Figure 5 |. Modeled effect of learning-induced sheath and nodal dynamics on conduction.

a, Schematic of myelinated axon model. Control trace and example traces of three categories of propagation along the modified region of axon: no change in conduction speed (“Success”), slowed conduction speed (“Delayed”), and failure to propagate (“Failure”). Note the arrival time of the control spike (dark pink) vs. the arrival time in each condition indicated (light pink). b, Matrix of conduction speeds across node relative to the ratio of sodium:leak conductance. Node lengths are characteristic of lengths before learning (“Pre-learn”, 1 micron), directly after learning (“Learn”, 20 microns), two weeks following learning (“Post-learn”, 35 microns), and of a large unmyelinated gap filled in by sheath addition (“Maximum observed”, 184 microns). c, Proportion of events that result in successful (lime), delayed (teal), or failures (navy) in propagation at 1, 20, 35, and 184 micron lengths. d, Modeled conduction speed as a function of sodium:leak conductance ratio at 1, 20, 35, and 184 micron lengths. e, Schematization of model used to predict the effect of coupled node lengthening and sheath retraction on conduction speed. Nodes were lengthened incrementally from 1 to 40 microns and associated sheaths were retracted a reciprocal amount. Asterisks indicate node retraction, while blue sheaths indicate sheath retraction. Nodes and sheaths were modified sequentially until 7 adjacent nodes were being lengthened at once. Four conductance ratios were modeled separately, using either 0.4 S/cm2 or 3.4 S/cm2 for sodium conductance (gNa) and either 0.01 S/cm2 or 0.08S/cm2 for leak conductance (gL). f, Modeled change in conduction speed as a function of node length at each of the four gNa:gL ratios with 1 (left) or 7 (right) nodes modified. g, Modeled conduction speed at a node length of 35 microns (dotted line in (f)) as a function of number of nodes modified. Learning modulates modeled conduction speed (F7,21=17.33, p<0.0001). Modification of 1 node significantly reduces conduction speed (0 vs. 1 nodes modified, p=0.0008; Tukey’s HSD), as does modification of 6 nodes (1 vs. 6 nodes modified, p=0.042; Tukey’s HSD). h, Schematization of model used to predict the effect of adjacent sheath addition on conduction velocity. Sheaths of 60 microns in length were added sequentially to a 184 micron unmyelinated gap. i, Modeled change in conduction speed as a function of sheaths added. j, Modeled conduction speed as a function of coverage of the unmyelinated gap, averaged across the four sodium:leak conditions. Sheath addition modulates conduction speed (F3,9=14.39, p=0.0009). The addition of a sheath that completely closes the unmyelinated gap results in a significant increase in conduction speed (p=0.01; Tukey’s HSD; shading represents 95% confidence interval). *p<0.05, **p<0.01, ***p<0.0001, NS, not significant; bars and error bars represent mean±s.e.m. For detailed statistics, see Supplementary Table 3, Figure 5.
