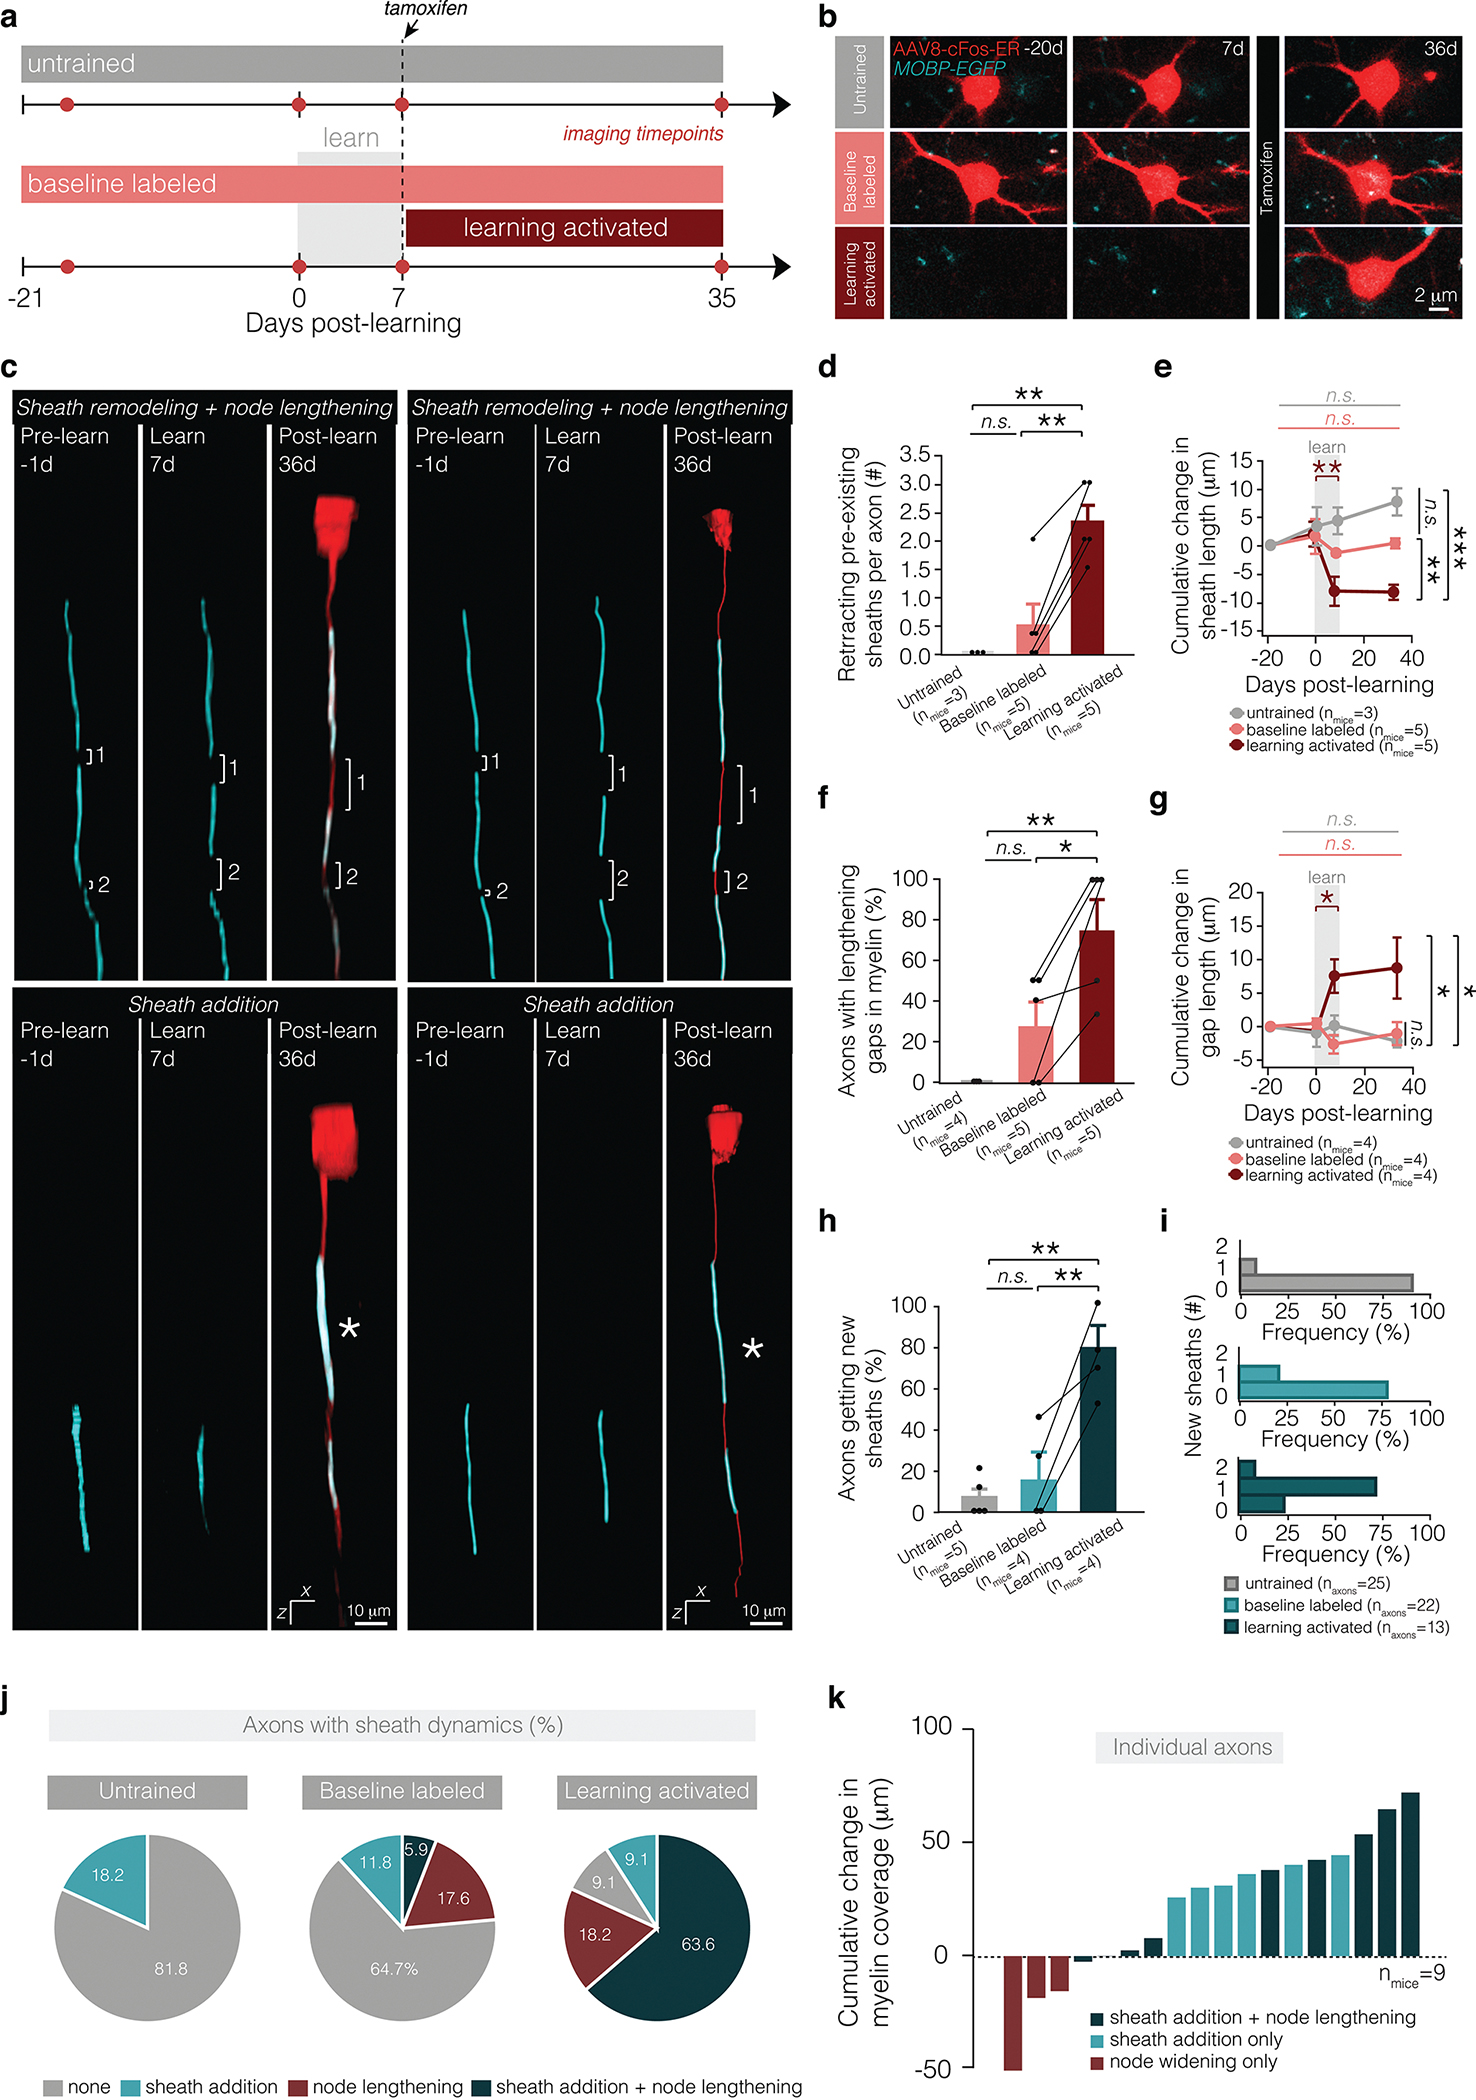
Figure 6 |. Learning-activated axons exhibit heightened myelin dynamics.

a, Time course of experiment and appearance of tdTom+ labeling in experimental groups. b, Representative images of baseline-labeled and learning-activated neurons in untrained mice (top), learning mice (middle), and neurons labeled following learning and administration of 4-OHT in learning mice (bottom). c, Reconstructions of Layer 2/3 axons exhibiting coupled node lengthening and sheath retraction (top) and sheath addition (bottom) following learning. See Supp. Fig. 8 for raw data associated with reconstructions. d, Learning modulates number of retracting sheaths per axon (F2,26.19=6.65, p=0.0007). One month after learning, learning-activated axons have significantly more sheath retraction relative to axons labeled at baseline in learning mice (p=0.0007; Tukey’s HSD) and in untrained mice (p=0.0062; Tukey’s HSD). Dot and error bars represent median and I.Q.R. e, Learning modulates dynamics of sheath retraction (F6,7.14=28.07, p<0.0001). During learning, sheaths on behaviorally-activated axons retract significantly (p=0.0065; Tukey’s HSD), and one month after learning, sheaths are significantly shorter than sheaths on baseline-labeled axons in learning mice (p<0.0026; Tukey’s HSD) and in untrained mice (p<0.0001; Tukey’s HSD). f, Learning modulates the proportion axons with lengthening nodes (F2,14.68=2.96, p=0.029). One month after learning, a significantly higher proportion of learning-activated axons have node lengthening relative to axons labeled at baseline in learning mice (p=0.030; Tukey’s HSD) and in untrained mice (p=0.044; Tukey’s HSD). g, Learning modulates dynamics of node lengthening (F6,4.76=24.32, p=0.0025). During learning, nodes on learning-activated axons retract significantly (p=0.022; Tukey’s HSD), and one month after learning, nodes are significantly longer than nodes on baseline-labeled axons in learning mice (p=0.047; Tukey’s HSD) and in untrained mice (p=0.020; Tukey’s HSD). h, Learning modulates the proportion axons with new sheath addition (F2,25.02=8.70, p=0.0002). One month after learning, a significantly higher proportion of learning-activated axons have new sheath addition relative to axons labeled at baseline in learning mice (p=0.0006; Tukey’s HSD) and in untrained mice (p=0.0004; Tukey’s HSD). i, The majority of learning-activated axons receive 1 new sheath following training. j, Proportion of axons showing no dynamics (grey), only sheath addition (pink), only node lengthening (red), or both sheath addition and node lengthening (dark red). k, Cumulative change in myelin coverage on individual axons from baseline to four weeks post-learning. *p<0.05, **p<0.01, ***p<0.0001, NS, not significant; bars and error bars represent mean±s.e.m unless otherwise noted. For detailed statistics, see Supplementary Table 3, Figure 6.
