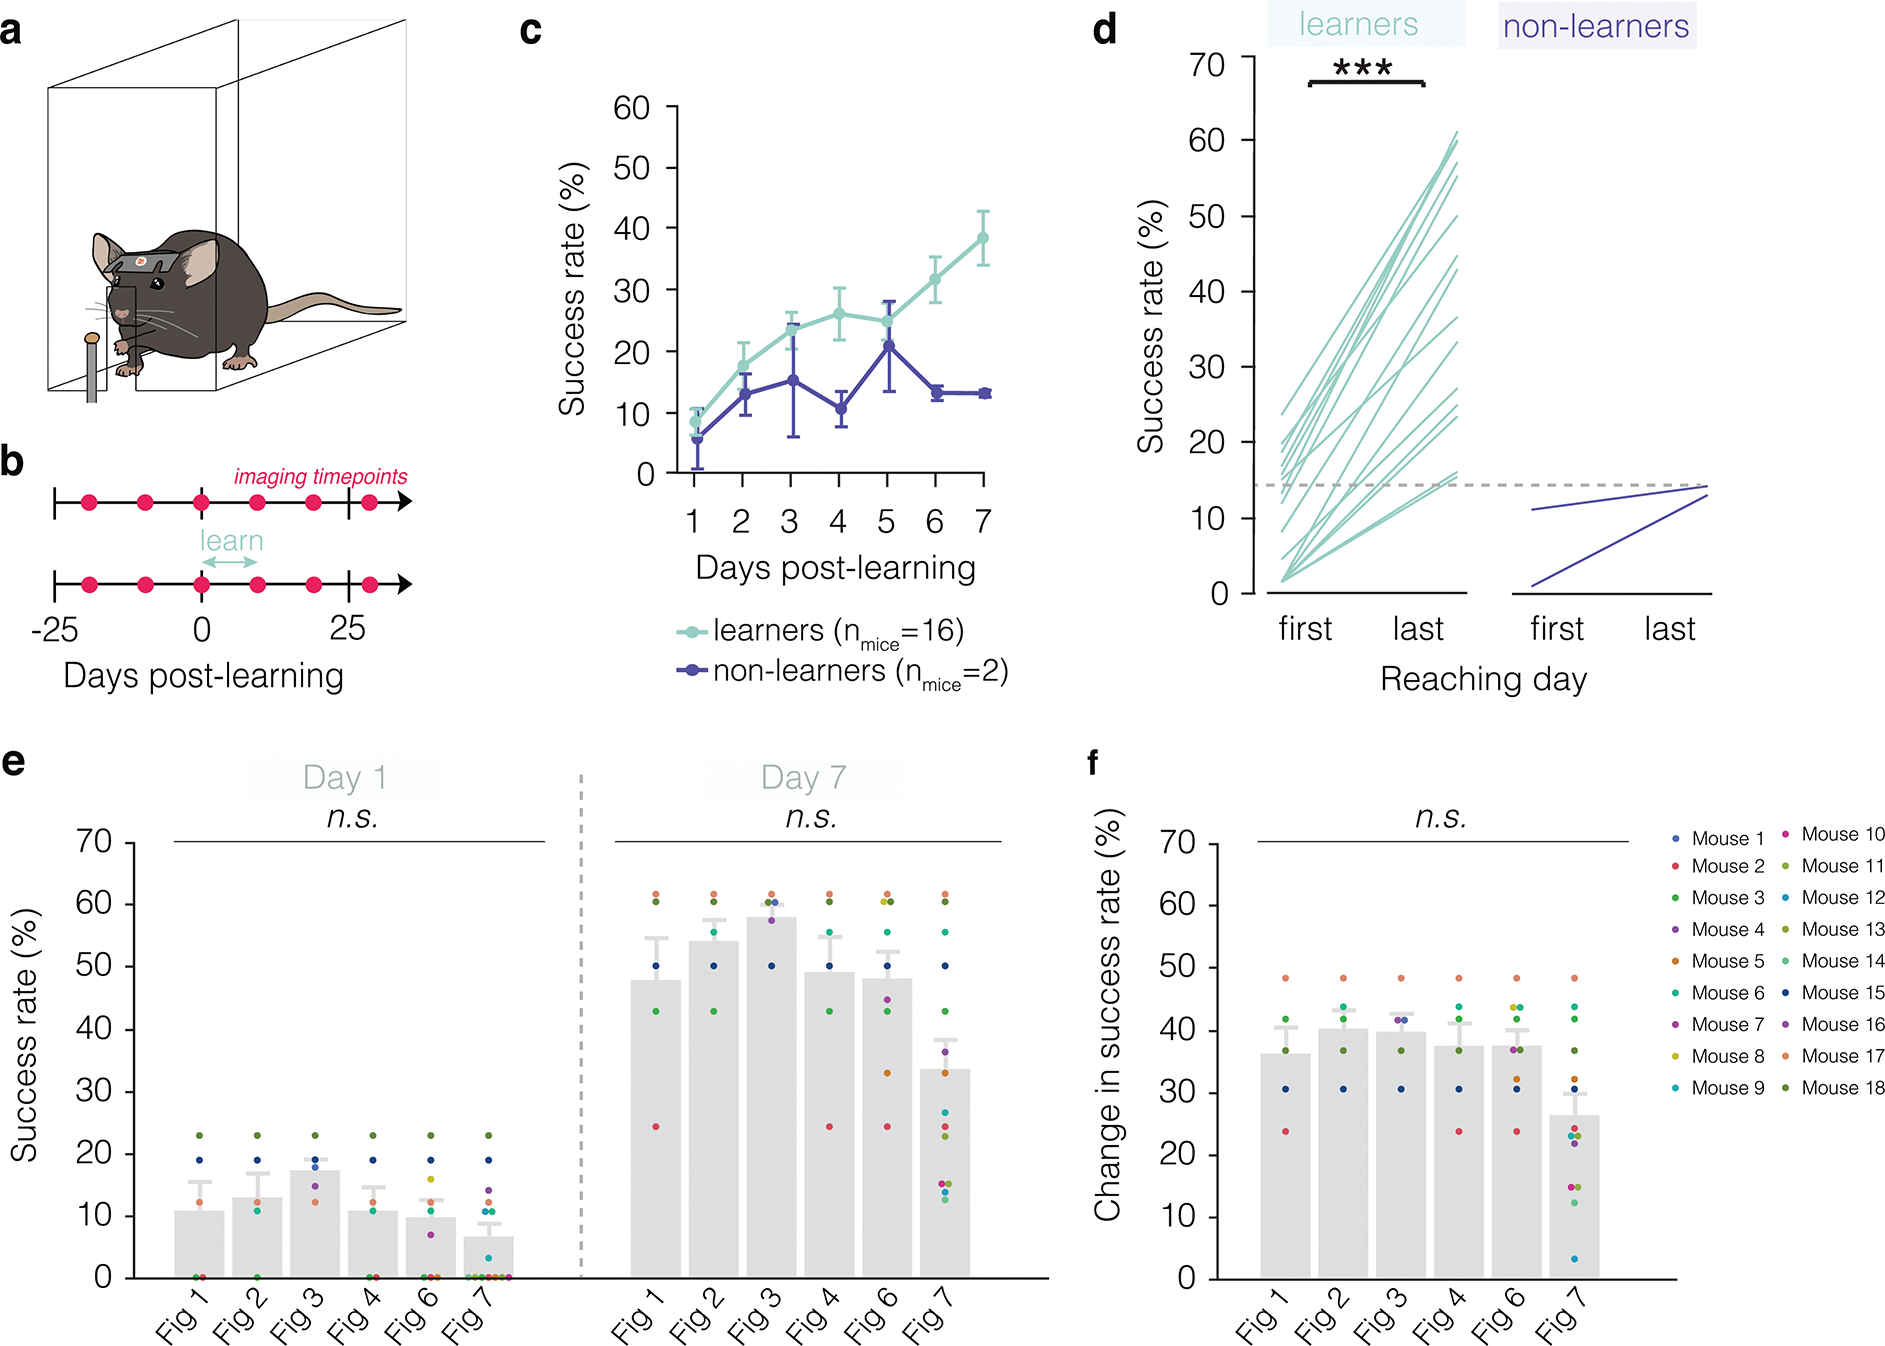
Extended Data Fig. 2. Learning trajectory of mice engaging in forelimb reach training.

a, Illustration of forelimb reach training box environment. Mice learn to reach by extending their left hand through a slit in a plexiglass box to grab a pellet and return it to their mouth. b, Imaging and training timelines for untrained (top) and learning (bottom) mice. c, The majority of mice learn to perform the forelimb reach task (learners, green). Learners improve their success rate gradually over the course of seven days of training. In contrast, non-learners maintain a low success rate across time and do not attain higher than a 15% success rate at the end of the training regimen (purple). d, Successful learners of the task perform significantly better on the last day of training (Paired Student’s t-test, t(15)=11.72, p<0.0001) and achieve higher than 15% success rate, in contrast to non-learners which do not improve significantly and do not attain above 15% success on the last day of training. Mice were excluded from data analysis if they did not succeed in at least 10% of reaches across the seven days of training (n = 2 mice). e, f, Breakdown of all mice included in each of the figures, where each dot is a unique color that represents a single mouse and is consistent across graphs. Neither success rate (e) nor change in success rate (f) differ across figures (REML with post-hoc Tukey’s HSD). Bars and error bars represent mean ± s.e.m unless otherwise noted. For detailed statistics, see Supplementary Table 3.
