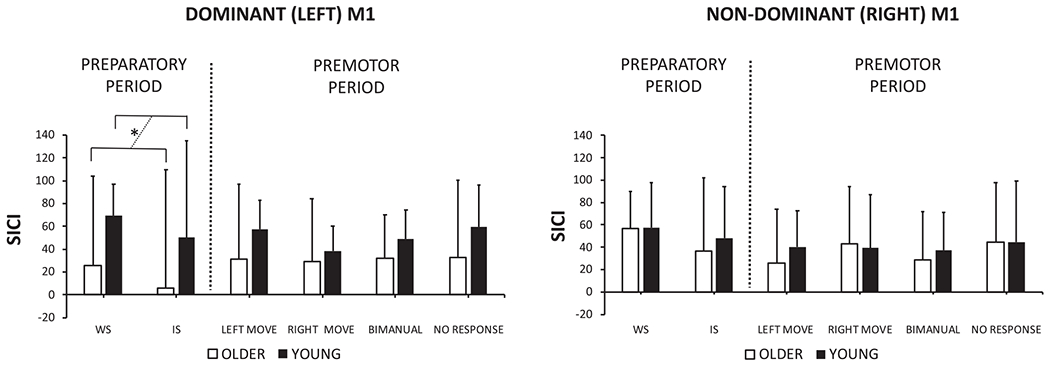
Fig. 4.

Short-interval intracortical inhibition (SICI) profiles for older and young adults for the left and right hemisphere at the warning signal (WS), imperative signal (IS) and at 75% of the EMG onset (left move, right move, bimanual and no response). SICI was defined as: (1 – (MEPpp/MEPsp)) * 100. Positive values indicate inhibition and negative values indicate disinhibition. The dashed line emphasizes the age group (young vs. older) comparison. P < 0.05 is indicated by an asterisk.
