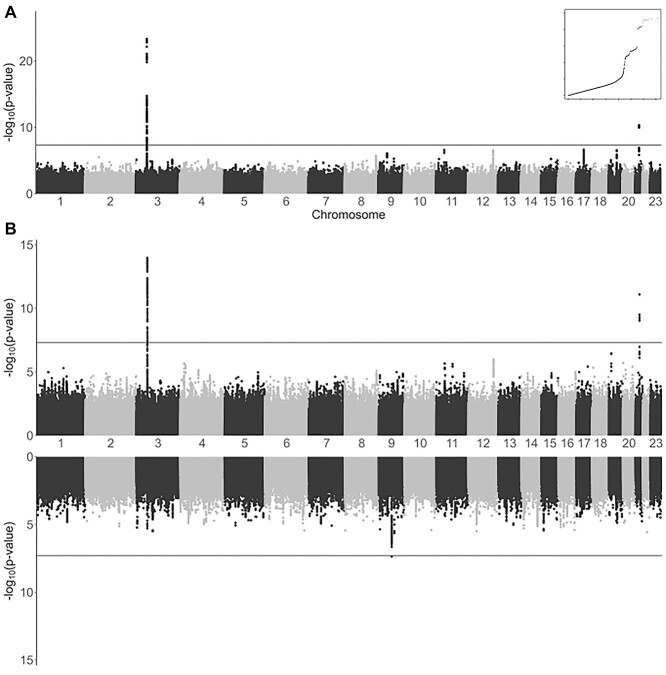
Figure 1.
Association results of SCOURGE for global and sex-disaggregated A1 hospitalization analysis. (A) Manhattan plot of results from global analysis. A quantile–quantile plot of the global analysis is also shown as an inset. (B) Miami plot of results from sex-disaggregated analyses (top: males and bottom: females).

