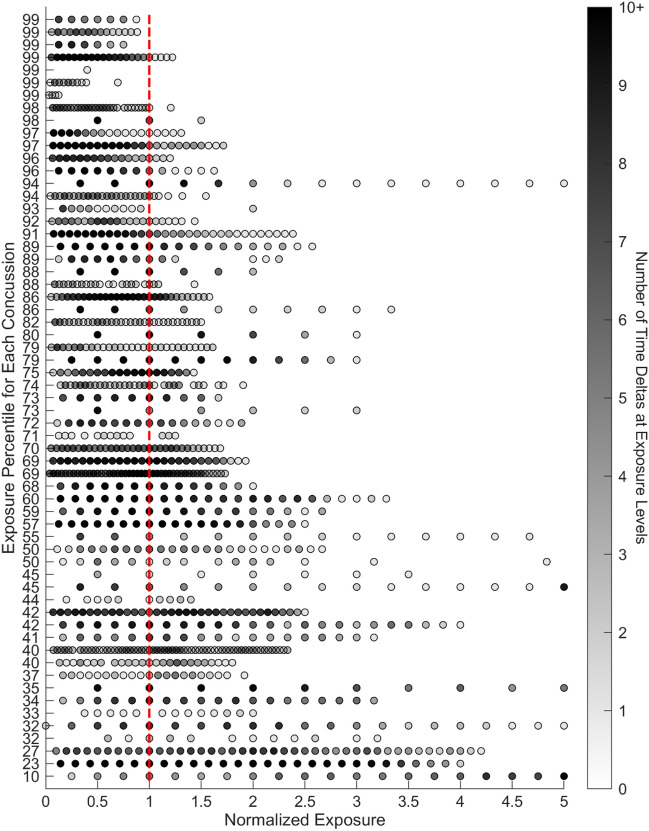
Figure 3.
Intra-athlete analyses of the day of injury time delta impact exposure vs. all other non-injury time deltas. The number of impacts over each time delta window for every session during the season are normalized to the number of impacts over the time delta on the injury date. Each row shows the HIE history for each concussion from the season of injury. The vertical red line represents the normalized exposure on the day of injury, each dot represents a session an athlete participated in, and the shading is used to reflect the number of sessions at an exposure level. The darker the circle is equivalent to more sessions at a specific exposure level.

